How to Turn Your Packaging Line Into a Competitive Advantage Before the Market Forces Your Hand
A cosmetic contract manufacturer in Southeast Asia lost a $2.4 million annual contract in 2024 because their tube supplier could not provide documentation proving PCR (Post-Consumer Recycled) plastic content. The brand didn’t leave because of price or quality. They left because of a sustainability audit finding that the manufacturer had no plan to address.
That scenario is no longer unusual. It is becoming standard.
The global tube packaging market, valued at $13.4 billion in 2025, is undergoing a materials and compliance transformation that is accelerating faster than most supply chains anticipated. The EU Packaging and Packaging Waste Regulation (PPWR) entered into force on 11 February 2025. EPR schemes are expanding across North America, Asia-Pacific, and the Middle East. Major cosmetic brands — L’Oréal, Unilever, Beiersdorf — have publicly committed to specific recycled content targets in their primary packaging by 2025–2027, and those commitments are now embedded in supplier qualification requirements.
This guide is written exclusively for manufacturers producing cosmetic or pharmaceutical tubes, distributors and agents sourcing or selling tube packaging machinery, and machinery suppliers advising customers on sustainable transitions. It will not tell you that “sustainability is important.” It will show you exactly where your waste is costing you money, which material and machinery choices resolve it, and how to execute a transition without disrupting customer supply.

Understanding Your Current Waste Problem and Its True Cost
Why Traditional Tube Packaging Is Costing You More Than Money
The scrap line on your production report shows material waste. It does not show the contracts you are not winning, the retailer audit findings you are accumulating, or the regulatory exposure building up in markets where EPR enforcement is becoming active.
Hidden Expenses Beyond Material Costs
Manufacturers commonly allocate up to 2.2% of annual revenue to scrap and rework. For a tube manufacturer with $10 million in annual revenue, that is $220,000 per year in direct waste cost. But the indirect cost structure around that number is larger:
Regulatory fine exposure is quantifiable and rising. Under the EU’s PPWR (Regulation 2025/40), eco-modulation means EPR fees are calibrated to packaging recyclability — non-recyclable packaging carries higher producer responsibility costs than recyclable alternatives. A tube construction that cannot be recycled in the target market’s existing infrastructure will cost you more to place in that market starting from August 2026.
Lost customer loyalty is harder to put on a single line item, but the direction is unambiguous. A 2024 McKinsey report found that 74% of consumers are willing to pay more for products using sustainable packaging. For your customers — the cosmetic and pharma brands buying your tubes or your machinery — this creates a revenue incentive to qualify sustainable suppliers and a business risk in staying with non-compliant ones.
Brand reputation damage accumulates gradually and collapses suddenly. The manufacturer who is the subject of a greenwashing enforcement action or a sustainability audit failure by a major retail buyer will spend 12–18 months recovering a supplier position that took years to build.
How Consumer Demand for Sustainable Packaging Directly Impacts Your Sales
The biodegradable cosmetic packaging market was valued at $8.4 billion in 2025 and is projected to reach $13.8 billion by 2034 at a 6.8% CAGR. That growth represents customer purchasing decisions — brands choosing material suppliers and machinery partners who can deliver compliant, documented, eco-positioned tubes.
If your production line cannot run PCR materials, cannot document recycled content percentages, and cannot provide a Responsible Sourcing declaration, you are already excluded from the fastest-growing segment of your addressable market.
The Competitive Disadvantage of Ignoring Sustainability in 2025
Here is the operational reality: manufacturers who are starting their sustainability transition now will be 18–24 months ahead of those who wait until regulatory mandates make it mandatory. That time advantage matters because material qualification takes 3–6 months, equipment adaptation takes 2–4 months, and certification processes take 3–12 months. Those timelines stack — they do not run in parallel.
The manufacturers who start today have options. The manufacturers who start in 2026 have deadlines.
Real ROI Calculations: What Waste Actually Costs Your Operation
Work through this with your own production data:
| Cost Category | Typical Range | Your Line Estimate |
|---|---|---|
| Direct scrap (material cost) | 1.5–2.5% of revenue | — |
| Rework labor (per defective unit) | $0.08–$0.35 per unit | — |
| Quality inspection overhead | 3–6% of production cost | — |
| EPR fees (EU, non-recyclable) | €0.05–€0.15 per unit | — |
| Customer audit remediation | $15,000–$80,000 per event | — |
| Lost contracts (estimated) | 5–15% annual revenue risk | — |
When these numbers are consolidated, most mid-size tube manufacturers find that sustainability-related cost exposure is running at 4–8% of annual revenue — roughly equivalent to or greater than the capital investment required to address it.
Identifying Waste Across Your Production Line
Most tube manufacturing waste falls into three categories. Understanding which category dominates your line determines which solutions have the fastest payback.
Common Waste Sources in Tube Manufacturing
Material scrap is generated during start-up sequences when extrusion parameters are not at steady-state, during format changeovers when the line is purged, and during any trim or end-of-tube cut where material is removed. On a line running 20 tube formats annually, start-up and changeover scrap alone can represent 3–5% of total material throughput.
Failed quality checks — tubes rejected for out-of-specification wall thickness, seal failures, color deviation, or dimensional error — represent material that has had full manufacturing cost applied before being discarded. At a rejection rate of 2% on a line producing 50,000 tubes per day, that is 1,000 full-cost units per shift entering the waste stream.
Inefficient production processes — running equipment at sub-optimal parameters, using fill systems that generate overfill or underfill waste, or running ink systems without closed-loop ink return — create ongoing material losses that are often invisible because they are never measured as discrete events.
How to Audit Your Current Packaging Waste Without Disrupting Operations
A 30-day waste audit requires no production changes and provides the data needed to prioritize reduction investments:
- Measure and record all material inputs (tube material, ink, labels, fill product) entering the line
- Measure all saleable outputs leaving the line
- Categorize all non-saleable material by failure mode (start-up scrap, rejection, changeover purge, fill waste)
- Assign material cost to each category based on your bill of materials
The gap between inputs and outputs — when disaggregated by category — shows you exactly where your biggest reduction opportunity sits. Manufacturers who have done this audit consistently find that 60–70% of their waste falls into two or three categories that can be addressed by specific, targeted interventions.
Benchmarking Your Waste Against Industry Standards
Industry benchmarks for tube manufacturing waste:
- Material scrap rate: Best-in-class 0.8–1.5%; industry average 2.0–3.5%; improvement needed above 4%
- Rejection rate (finished tube): Best-in-class below 0.5%; industry average 1–2.5%; immediate action above 3%
- Energy consumption per 1,000 tubes: Best-in-class with servo-driven equipment: 2.8–4.2 kWh; conventional equipment: 4.5–7.0 kWh
If your operation is running above the industry average in any category, the investment to reach best-in-class typically pays back within 12 months in direct material and energy savings alone.
Red Flags That Indicate Your Production Process Needs Optimization
- Fill weight variation above ±1.5% of target (best-in-class is ±0.3–0.5%)
- Seal integrity rejection rate above 1% (indicates sealing system calibration or material compatibility issues)
- Ink waste above 8% of ink purchased (indicates batch size mismatch or ink recovery system absence)
- Machine downtime above 15% of scheduled production time (indicates preventive maintenance gaps)
- Changeover time above 90 minutes per format (indicates tooling standardization opportunity)
Regulatory and Market Pressures You Can’t Ignore
New 2025 Packaging Regulations Affecting Manufacturers
The regulatory landscape shifted materially in early 2025. The key frameworks your operation needs to track:
EU Regulation 2025/40 (PPWR — Packaging and Packaging Waste Regulation) entered into force on 11 February 2025 and will begin applying from 12 August 2026. Its requirements for tube packaging manufacturers include mandatory recyclability targets, minimum recycled content percentages (phased in from 2030 onward), and eco-modulation of EPR fees based on packaging environmental performance. For pharmaceutical industry tube manufacturers specifically, the EU PPWR analysis from SPGL provides a sector-specific compliance breakdown.
US State-Level Recycled Content Laws: As of mid-2025, five US states have enacted laws requiring minimum post-consumer recycled content in plastic packaging. Tube manufacturers supplying into California, Colorado, Maine, Oregon, and Washington face specific compliance timelines that are already in effect.
UK Extended Producer Responsibility: The UK’s EPR scheme is now mandatory for producers, with recycling labeling requirements being phased in. Cosmetic tube packaging must be assessed and labeled by packaging category under the scheme.
Extended Producer Responsibility Requirements by Region
EPR schemes make producers financially responsible for the end-of-life management of their packaging. For tube manufacturers and machinery distributors, the practical impact is that the tube materials you specify today determine the EPR fee exposure your customers (the brand owners) carry for the product lifetime. Helping customers choose materials with established recycling infrastructure is not a sustainability gesture — it is a cost reduction service.
The EUROPEN EPR framework provides current EU scheme details. Regional variations in collection infrastructure mean that a tube construction recyclable in Germany may not be recyclable in Portugal under that country’s current sorting technology — a distinction that matters for manufacturers distributing across multiple EU markets.
How Sustainability Certifications Impact Distributor Relationships and Machine Sales
Distributors and agents sourcing tube packaging machinery increasingly face customers who ask: “Does this machine support sustainable material processing?” The answer affects the sale. Machinery that can process 100% PCR materials, handle bio-based polymers without additional die modifications, and generate energy and material consumption data for sustainability reporting is a competitive specification — not a premium feature.
Exploring Eco-Friendly Tube Material Alternatives for Your Production
Biodegradable Materials That Actually Protect Your Products
The word “biodegradable” on its own tells you almost nothing useful about packaging performance. What matters for a cosmetic or pharmaceutical manufacturer is whether a material provides adequate barrier properties, sufficient mechanical strength for its application, and documented compatibility with the specific formulation it will contain.
How Modern Biodegradable Polymers Maintain Barrier Properties
PHA (Polyhydroxyalkanoate): Produced by microbial fermentation of organic feedstocks, PHA is genuinely biodegradable in both industrial composting environments and, critically, in marine conditions — the failure mode that degrades ocean ecosystems. For cosmetic tube applications, PHA offers oxygen barrier properties competitive with conventional LDPE and can be processed on existing extrusion equipment with minimal parameter adjustment. The biodegradable cosmetic packaging market data shows PHA gaining share in premium personal care applications specifically because it combines authentic biodegradability claims with adequate performance for most cream and gel formulations.
PLA (Polylactic Acid): Derived from corn or sugarcane starch, PLA has established production scale, improving supply chain reliability. Its barrier properties are moderate — lower oxygen barrier than EVOH-containing laminates but adequate for many cosmetic cream and lotion applications. The key limitation: PLA requires industrial composting at temperatures above 55°C to biodegrade within commercially defined timeframes. Standard home composting is insufficient. This distinction is critical for labeling and greenwashing compliance (addressed in the certification section).
Comparing Performance: Traditional Plastics vs. Bio-Based Alternatives
| Material | OTR (cm³/m²/day) | WVTR (g/m²/day) | Compatible Applications | End-of-Life Pathway |
|---|---|---|---|---|
| Standard LDPE | 4,500–6,000 | 8–12 | All general cosmetic tubes | Recycle (where infrastructure exists) |
| PCR LDPE (50% content) | 4,200–5,800 | 8.5–12.5 | General cosmetic, body care | Recycle stream |
| PLA (tube grade) | 550–750 | 170–250 | Creams, lotions, body care | Industrial composting |
| PHA | 350–500 | 20–60 | Creams, gels, serums | Industrial or marine composting |
| PE/EVOH/PE laminate | 0.5–2 | 3–8 | Pharma, oxygen-sensitive formulas | Limited recycling |
| Aluminum (collapsible) | ~0 | ~0 | All pharma, premium cosmetic | 100% recyclable, indefinitely |
Which Materials Work Best for Different Product Types
The material-to-application match is the decision that determines whether a sustainable switch succeeds or fails:
- High-viscosity creams and ointments: PCR LDPE or PHA — adequate barrier, compatible processing
- Light-sensitive pharmaceutical preparations: Aluminum or PE/EVOH laminate with aluminum foil layer
- Water-based gels and serums: PHA or PLA — lower barrier acceptable given the aqueous chemistry
- Oral care products (toothpaste, dental gels): PCR PE or aluminum — the high-frequency squeeze cycles require material memory that brittle bio-plastics cannot provide
- Premium positioning cosmetics: Aluminum — the only format that simultaneously delivers premium aesthetic, 100% recyclability, and genuine sustainability credentials
Shelf-Life and Stability Considerations With Sustainable Materials
Switching tube material is not a labeling change — it is a stability study trigger. Any change to primary packaging material requires accelerated shelf-life testing (ASLT) under ICH Q1A conditions (40°C/75% RH for six months minimum) before the new material can be used for market supply. Budget 3–6 months and $15,000–$50,000 per SKU for this validation. Include this cost in your material switching business case — not discovering it after material commitment is made.
Aluminum and Paper-Based Tube Solutions
Why Aluminum Tubes Remain the Gold Standard for Sustainability
Aluminum is the only widely used tube packaging material with a genuinely established recycling value chain across all major markets. The recycling argument for aluminum is not aspirational — it is documented: aluminum can be recycled indefinitely without loss of material properties, and recycling aluminum uses approximately 5% of the energy required to produce virgin aluminum. Published lifecycle analysis data consistently shows that a recycled aluminum tube has a lower carbon footprint than any plastic alternative when measured over multiple use cycles through the recycling system.
For pharmaceutical manufacturers, aluminum provides absolute barrier to oxygen, moisture, and light — the complete protective property set that no plastic or bio-plastic laminate achieves at equivalent wall thickness.
The practical constraint is cost: aluminum tubes carry a 10–15% price premium over equivalent plastic alternatives at current commodity pricing. For pharmaceutical applications, where batch value is high and barrier failure risk is severe, this premium is straightforwardly justified. For cost-sensitive cosmetic categories, the business case depends on brand positioning and the EPR fee savings from improved recyclability.
Recyclability Rates and Environmental Impact Comparisons
Current global aluminum recycling rates average 69% for beverage containers (well-established collection infrastructure) but lower for cosmetic aluminum tubes due to variation in collection systems by market. Plastic tube recycling rates average 14–22% globally across all markets — constrained by the difficulty of separating multi-layer laminate constructions in mechanical recycling processes.
The implication: if your customer is calculating EPR fees based on actual recycling rates rather than theoretical recyclability, aluminum tubes will generate lower EPR cost exposure in most EU markets than multi-layer plastic laminates.
Paper Composite Tubes: A Viable Alternative for Specific Applications
Paper composite tubes — constructions that use recycled paperboard as the structural layer with thin inner and outer coatings — are the fastest-growing segment of the sustainable tube market, with paperboard and bio-based formats forecast to expand at an 8.58% CAGR through 2033.
Their applicability for cosmetic and pharmaceutical tubes is real but bounded:
Well-suited for: Dry cosmetic powders, solid bar products, waterless formulations, beauty supplement tubes, and decorative packaging for powder-based color cosmetics.
Not suited for: Aqueous formulations, high-humidity storage environments, products requiring squeeze-and-recover dispensing (paper composites do not have the material memory of PE), or any formulation where the coating layer’s barrier is insufficient for the product’s stability requirements.
Cost-Benefit Analysis of Material Switching
For a manufacturer producing 2 million tubes per year in standard LDPE and considering a switch to paper composite for a suitable SKU subset:
| Factor | LDPE (Current) | Paper Composite (Alternative) |
|---|---|---|
| Material cost per tube | $0.08 | $0.12 (+50%) |
| EPR fee (EU estimate) | €0.06 per unit | €0.02 per unit |
| Recyclability in EU markets | 15–20% | 65–75% |
| Brand premium potential | Baseline | 8–15% price uplift documented |
| Stability study cost | N/A (baseline) | $20,000–$40,000 one-time |
For premium brand positioning in EU markets, the paper composite premium is often recovered through product pricing — brands using verifiably sustainable packaging can command and receive a 8–15% retail price premium in European markets.
Compostable and Plant-Based Tube Innovations

Emerging Materials Gaining Traction in 2025: PHA, PLA, and Advanced Bio-Composites
The material science around bio-based packaging has advanced significantly since the early-generation PLA applications of 2015–2020. Current generation materials offer:
Bio-PE (Bio-based Polyethylene): Chemically identical to fossil-derived PE but manufactured from sugarcane ethanol. Processable on existing PE extrusion equipment without modification. Does not biodegrade but is recyclable in the PE stream. The key advantage is a drop-in replacement — no stability studies required if the base polymer specification matches your current material.
PHA blends: Second-generation PHA copolymers (PHBV, P3HB) offer improved flexibility and lower processing temperatures compared to early PHA grades, making them more compatible with existing tube extrusion equipment. Barrier properties have improved to the point where they are now viable for moderate-barrier cosmetic applications without additional laminate layers.
Advanced bio-composites: Wood-plastic composites and natural fiber-reinforced bio-based polymers are entering cosmetic packaging in rigid tube shoulder applications — not yet the tube body, but the shoulder injection-molded component represents an early entry point for bio-based material adoption on existing lines.
Certification Requirements for “Compostable” Claims
This is where many manufacturers create regulatory and reputational risk through imprecise language. The relevant standards:
- EN 13432 (Europe): Required for “compostable” claims in the EU — specifies 90% disintegration within 12 weeks under industrial composting conditions
- ASTM D6400 (North America): Equivalent US standard for industrial compostability certification
- OK Compost INDUSTRIAL (TÜV Austria): Third-party certification program verifying conformance with EN 13432
- OK Compost HOME: Higher standard requiring biodegradation at lower temperatures consistent with home composting — very few tube materials currently qualify
The FTC’s Green Guides in the US explicitly state that “compostable” claims must be qualified if the material requires industrial composting — claiming a product is “compostable” without specifying the industrial facility requirement is an actionable misleading claim. The EU Green Claims Directive (in development) will impose equivalent or stricter requirements across EU markets.
Sourcing Reliable Suppliers of Sustainable Raw Materials
Supplier diversification is operationally essential for bio-based materials, where supply chains are less established than conventional polymer supply chains. Build a minimum of two qualified suppliers per material type before committing to production. Negotiate price-stability provisions in long-term contracts — bio-based polymer pricing correlates with agricultural commodity prices, which carry more volatility than petrochemical feedstocks.
Optimizing Your Production Equipment for Minimal Waste
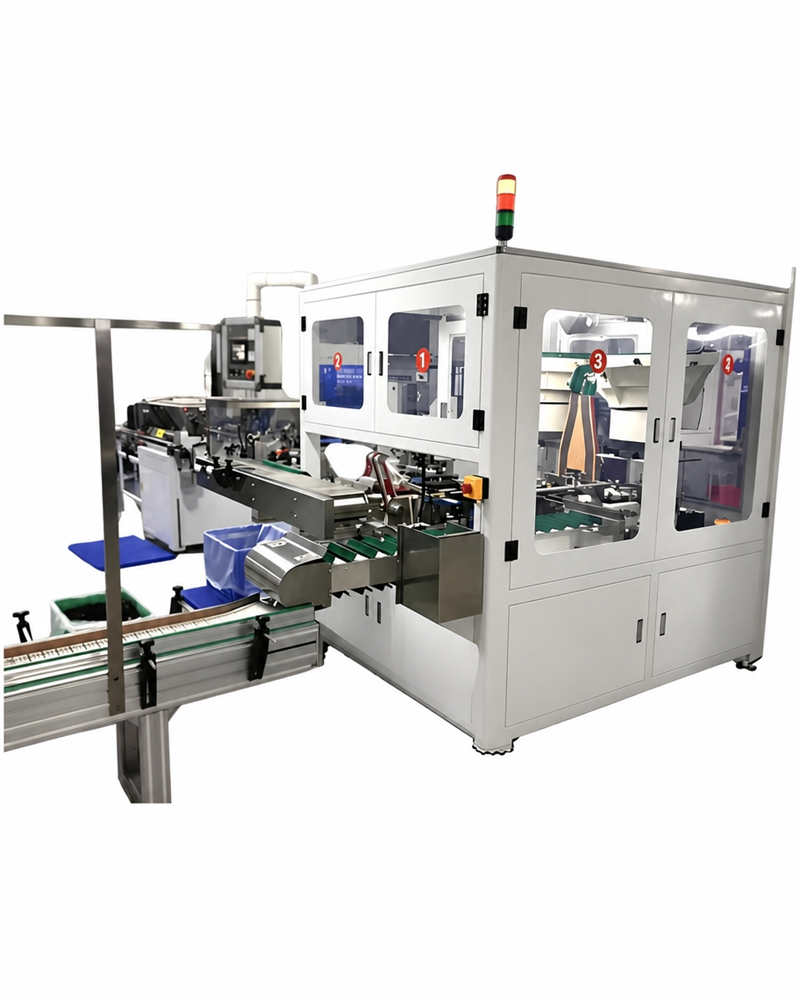
How Modern Tube Manufacturing Machines Reduce Material Loss

Watch: Modern tube extrusion technology demonstrating PCR material processing, multi-layer co-extrusion, and automated quality control for minimal production waste.
Technology Advances That Decrease Scrap Rates
The most significant technology developments in tube manufacturing equipment over the past five years are directly linked to waste reduction:
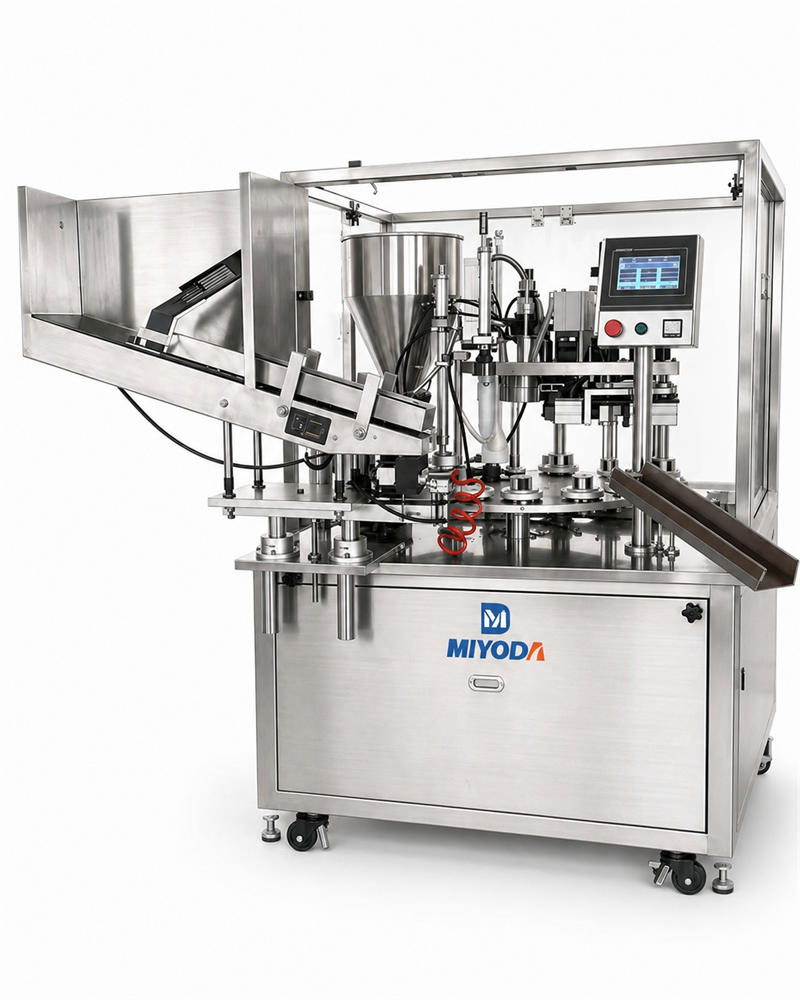
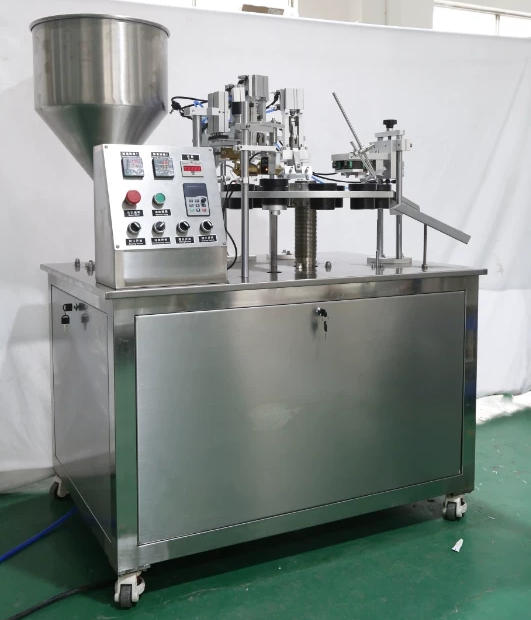
Servo-driven extrusion systems replace pneumatic actuators with electric servo motors that provide precise, repeatable control at every production stage. The impact on waste is quantifiable: servo-driven tube filling machines from Miyoda Packaging Machinery consume 30–40% less energy than pneumatic-actuator equivalents while delivering fill weight accuracy within ±0.3% of target — compared to ±1.5–2% typical of older pneumatic systems. The fill accuracy improvement alone eliminates the out-of-specification tube rejection that commonly accounts for 30–40% of production waste.
Laser diameter control monitors tube outer diameter in real-time during extrusion and adjusts the vacuum sizing system automatically to maintain specification without manual intervention. This eliminates the batch of off-specification tubes that previously required production to be stopped, adjusted manually, and material purged before restart.
EVOH ultra-thin barrier layers (0.01–0.02 mm) in multi-layer co-extrusion provide oxygen barrier performance equivalent to thick single-layer barrier films while using 85–90% less barrier material. This is material efficiency engineering — the same protective function with a fraction of the material input.
PLC recipe storage enables format changeover by selecting a stored recipe from the touch screen rather than manually resetting temperature profiles, line speeds, and die dimensions across multiple machine stations. Format changeover waste — the material purged between the end of one run and the start of the next — is reduced from 45–90 minutes of production output to 15–25 minutes, a 60–70% reduction in changeover waste.
The Miyoda tube extrusion machine is fully compatible with 100% post-consumer recycled (PCR) materials and delivers 20% energy savings compared to conventional equipment — a specification that directly addresses both the sustainability requirement and the operational cost case for upgrade.
Precision Engineering Features That Improve First-Pass Quality
Wall thickness precision of 0.02 mm on modern extrusion systems ensures that every tube dispensed from the machine performs consistently — the same squeeze force delivers the same volume, meeting the consumer experience expectation and eliminating the waste generated when over-thinned tube walls fail during filling or distribution.
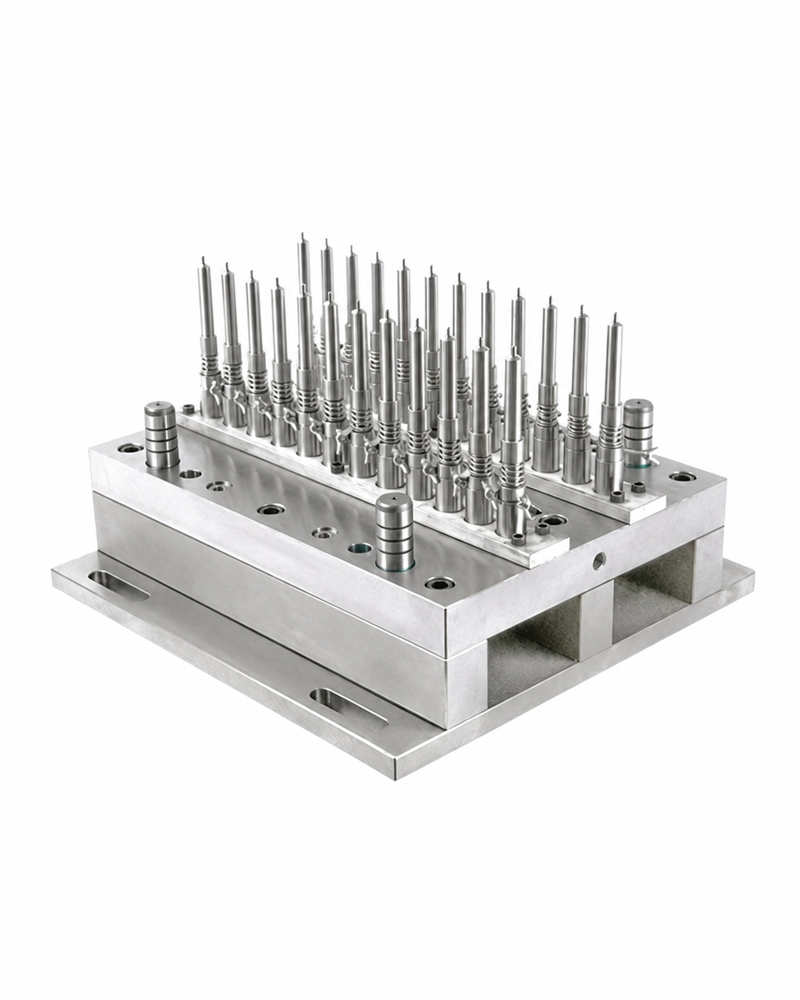
Spiral runner mold design eliminates fusion lines in multi-layer tube constructions — the weak points where layers join under conventional die designs. Fusion line elimination reduces structural failures that cause mid-run rejection events and the material waste those events generate.
Automated out-of-tolerance rejection systems identify and divert out-of-specification tubes at the production stage — before they have had fill product, label, and cap applied. A tube rejected at extrusion costs $0.08 in material. The same tube rejected after filling, labeling, and capping costs $0.65–$1.20 in total.
ROI Timeline for Upgrading to Waste-Reducing Equipment
A tube filling line upgrade from pneumatic to servo-driven technology, at a capital cost of $45,000–$90,000, generates the following documented savings on a line running 30,000 tubes per day:
| Savings Category | Annual Value |
|---|---|
| Fill weight accuracy improvement (1.5% → 0.3% variance) | $18,000–$45,000 |
| Rejection rate reduction (2.5% → 0.4%) | $22,000–$55,000 |
| Energy reduction (30–40% lower consumption) | $6,000–$14,000 |
| Changeover waste reduction (70% less purge) | $8,000–$18,000 |
| Total annual saving | $54,000–$132,000 |
| Equipment investment | $45,000–$90,000 |
| Payback period | 5–20 months |
Retrofitting Existing Lines vs. Investing in New Machinery
Cost-Effective Modifications to Your Current Production Setup
Before committing to full equipment replacement, evaluate whether targeted modifications deliver an acceptable return at lower capital outlay:
Temperature controller upgrades: Replacing legacy PID controllers with modern multi-zone PLC-integrated temperature systems can reduce temperature variation across the die from ±5°C to ±1°C, meaningfully improving seal consistency and reducing seal-zone rejection rates. Capital cost: $3,000–$12,000 per machine.
Die modification for bio-based materials: Bio-based polymers including PHA and PLA typically require lower processing temperatures and modified land lengths compared to LDPE. A die modification by your equipment manufacturer can adapt an existing extrusion line for bio-based material processing without full machine replacement. Capital cost: $5,000–$20,000 per die set.
In-line weight verification: Adding a check-weigher with automated rejection capability to an existing filling line eliminates the operator-dependent end-of-line sampling that misses fill weight drift events between sample intervals. Capital cost: $8,000–$25,000 installed.
When Upgrading Equipment Becomes the Smarter Financial Decision
Equipment upgrade becomes more financially rational than modification when: the machine is more than 8–10 years old and spare parts lead times are extending (indicating supplier support wind-down), the modification cost exceeds 35–40% of a new equivalent machine’s purchase price, or the machine cannot physically be adapted for the material constructions your customer portfolio is moving toward (for example, a die design that cannot accommodate EVOH co-extrusion is a fundamental limitation rather than a correctable parameter issue).
How to Calculate Payback Periods for Equipment Investments
Use the four-line payback formula:
$$\text{Payback (months)} = \frac{\text{Equipment Investment} \times 12}{\text{Annual Waste Reduction Savings} + \text{Annual Energy Savings} + \text{Annual Throughput Gain}}$$
Input your own production data. The payback period for modern waste-reducing equipment is almost always shorter than initially expected because the throughput gain component — the additional saleable output from higher first-pass quality — is frequently underestimated in initial calculations.
Process Optimization Without Equipment Changes
Workflow Adjustments That Minimize Production Waste Immediately
Not every waste reduction requires capital investment. These workflow changes typically generate measurable waste reduction within the first production quarter:
Standardize start-up sequences: Document the exact start-up parameter sequence for each tube format, including warm-up time, initial purge volume, and the parameter thresholds that confirm the line is at steady state before production is recorded. Implementing written start-up protocols consistently reduces start-up scrap by 30–50% within three months.
Reduce minimum batch sizes: Small pilot runs of new formats generate disproportionate changeover waste because the fixed purge volume represents a larger percentage of the total run. Consolidating small orders into larger runs, or scheduling small format batches at the end of production days when changeover into the next day’s first run absorbs the purge cost, can reduce changeover waste by 20–30% without any equipment change.
Implement ink return systems: Closed-loop ink return on screen printing stations recovers 60–80% of ink that would otherwise be purged at run end. Capital cost for a retrofit ink return system: $2,000–$8,000 per station. Annual ink cost saving at $120/kg for specialty inks: $4,000–$15,000 per station.
Staff Training Programs That Improve Material Handling Efficiency
A consistent finding across tube manufacturing facilities is that material handling practices — how raw tube stock is stored, transported, and staged before production — account for 15–25% of avoidable waste. Dropped or dented tubes, tube stock exposed to excess humidity, and tubes staged without first-in-first-out discipline that allows older stock to exceed shelf life all represent avoidable losses.
A two-day material handling training program for production staff, run annually, consistently produces 10–15% reduction in handling-related waste within the following quarter — at a training cost of $500–$2,000 total, against typical annual savings of $8,000–$30,000 depending on volume.
Preventive Maintenance Schedules That Reduce Machine Downtime and Waste
Unplanned machine stoppages generate waste in two ways: the material in the machine at the time of stoppage must typically be purged, and the production time lost to the stoppage and restart represents product not made. A documented preventive maintenance schedule that addresses seal jaw calibration, die cleaning, temperature system verification, and fill system calibration on defined intervals reduces unplanned stoppages and the associated waste events they generate.
Implementing Cost-Effective Waste Reduction Strategies
Material Efficiency Programs That Protect Your Margins
Supplier Negotiation Strategies for Sustainable Materials at Competitive Prices
The bio-based polymer price premium has narrowed significantly. Current market data shows bio-PE at a 3–7% premium over fossil-derived PE (down from 15–20% in 2020), PHA at a 12–20% premium (down from 40–60% in 2020), and certified PCR PE at a 5–12% premium over virgin PE. These premiums continue to compress as production scale increases.
Negotiation approaches that have proven effective in this market:
Long-term volume commitments in exchange for price stability: Bio-based material suppliers face demand uncertainty that makes multi-year volume commitments valuable to them — more valuable than short-term price premiums. A two-year volume commitment at current pricing protects your cost structure while the market price continues its downward trajectory.
Quarterly price review mechanisms with commodity index linkage: Bio-PE pricing correlates with sugarcane ethanol prices; PHA pricing correlates with corn prices. Building index-linked review clauses prevents surprise cost escalation while preserving the supplier relationship needed for supply continuity.
Volume Purchasing Approaches That Reduce Per-Unit Costs
The sustainable materials market is supply-constrained in some geographies, but that constraint applies primarily to spot buyers. Manufacturers with documented forecast commitments — monthly volumes with three-month rolling forecasts — access better pricing and priority allocation than spot buyers, regardless of total annual volume.
Joining industry purchasing consortiums — groups of non-competing manufacturers who aggregate purchasing volumes for negotiation — can provide small and mid-size manufacturers access to pricing that would otherwise require five to ten times their individual volume.
How to Pass Sustainability Benefits to Customers Without Sacrificing Profitability
The pricing conversation with customers about sustainable material premiums is most effectively framed around avoided costs rather than material cost increases. The customer who understands that your PCR tube eliminates their EPR fee exposure, reduces their carbon reporting burden, and enables a premium retail positioning has a complete business case for absorbing a 5–8% material premium. The customer who is only told “the sustainable tube costs more” does not.
Prepare a one-page customer sustainability value summary for each sustainable tube format you offer: EPR fee comparison, carbon footprint comparison (using published lifecycle analysis data), and recyclability rate comparison versus your standard offering. This shifts the conversation from “you’re asking me to pay more” to “here is what this saves me.”
Circular Economy Models for Tube Packaging

Take-Back Programs That Position Your Brand as a Sustainability Leader
Brand-level take-back programs — where consumers return empty tubes to retail collection points for recycling — have been implemented successfully by MAC Cosmetics (Back-2-MAC), Nordstrom (BEAUTYCYCLE), and several direct-to-consumer skincare brands. For tube manufacturers supplying these brands, the implication is that the tube material must be compatible with the collection and processing system specified in the brand’s take-back program.
For manufacturers, the business opportunity is to proactively develop tube constructions that are compatible with existing take-back infrastructure and communicate that compatibility to brand customers — becoming the supplier who enables the brand’s sustainability program rather than one who constrains it.
Partnerships With Recycling Facilities and Material Recovery Companies
Direct relationships with post-consumer material recovery facilities enable two things: first, a verified destination for production scrap that generates recycling documentation usable for sustainability reporting; second, access to recycled feedstock that can be incorporated back into your extrusion process as PCR content.
The closed-loop manufacturing model — where production scrap is returned to the material supply chain and PCR content from that recycling re-enters your tube material — is the operational expression of circular economy principles. Manufacturers operating this model can document it as a verified circular economy practice, which is a meaningful claim for customers with ambitious circularity commitments.
Closed-Loop Manufacturing Systems That Reuse Production Scrap
In-house regrind systems — mechanical grinders that convert production scrap back into granulate suitable for re-extrusion — enable immediate material recovery for mono-material or compatible-material scrap streams. The economics: at $1.20/kg for virgin PE granulate, recovering 500 kg of production scrap per month generates $600/month in avoided material cost — covering the capital cost of a small industrial regrinder in under 24 months.
The critical constraint: regrind material can only be incorporated at percentages that maintain the tube’s performance specification. Typically 10–20% regrind content is manageable without affecting mechanical or barrier properties; above 30%, rigorous testing is required to validate performance.
Energy and Resource Efficiency in Tube Production
Reducing Energy Consumption in Extrusion and Filling Processes
Modern servo-driven extrusion equipment consumes 20–30% less energy than equivalent conventional hydraulic or pneumatic systems by applying power only in proportion to the actual mechanical demand at each production stage. On a line running two shifts, five days per week, a 25% energy reduction translates to approximately 15,000–35,000 kWh per year in avoided consumption — at industrial electricity rates of $0.08–$0.15/kWh, a direct cost saving of $1,200–$5,250 annually per machine from energy reduction alone.
The Miyoda tube extrusion machine range is specifically engineered for 20% energy savings versus conventional equipment — a specification that becomes a sustainability reporting data point for manufacturers required to track and disclose operational carbon footprints under emerging disclosure frameworks.
Water Conservation Strategies Specific to Tube Manufacturing
The vacuum sizing and cooling system in tube extrusion uses cooling water to control tube diameter and wall structure during solidification. Conventional open-loop cooling water systems require continuous fresh water input and generate heated wastewater output. Closed-loop cooling water systems — where the cooling water is recirculated through a heat exchanger rather than discharged — reduce water consumption by 85–95% for this process step.
Capital cost of a closed-loop cooling system retrofit: $8,000–$20,000. Water cost saving at typical industrial water rates: $3,000–$9,000 annually. Additional benefit: elimination of the water quality management cost associated with maintaining cooling water chemistry in open systems.
Carbon Footprint Reduction That Appeals to Eco-Conscious Customers
Manufacturers who can provide a documented Scope 1 and Scope 2 carbon footprint calculation for their tube production operation — based on actual energy consumption data, actual material inputs, and verified emission factors — are materially better positioned with customers operating under their own carbon disclosure requirements (Science Based Targets initiative, CDP reporting, EU CSRD reporting) than competitors who provide only vague sustainability claims.
The data collection for carbon footprint calculation requires: energy meter installation at machine level, material input tracking by batch, and a defined emission factor methodology (typically using IEA grid emission factors for electricity and IPCC emission factors for process energy). Once the tracking infrastructure is in place, the calculation is relatively straightforward and the output is a marketing and sales asset.
Meeting Certification and Compliance Requirements
Navigating Sustainability Certifications Your Customers Demand
Certifications serve two distinct functions: they verify your internal processes and outputs against defined standards, and they communicate that verification to customers and regulators in a language they recognize. For tube manufacturers, the most operationally relevant certifications in 2025 are:
ISO 14001 and Environmental Management System Requirements
ISO 14001 — the international standard for Environmental Management Systems — is a process certification, not a product certification. It verifies that your organization has documented, implemented, and is continuously improving a system for managing your environmental impacts. It does not certify that your products are sustainable; it certifies that you are systematically managing your environmental performance.
For tube manufacturers, ISO 14001 provides three practical benefits: access to customers who require it as a supplier qualification criterion, a structured framework for identifying and quantifying your environmental waste (the audit process often surfaces waste streams that weren’t previously measured), and documented evidence of environmental management that supports regulatory compliance claims.
Initial certification cost: $5,000–$25,000 depending on facility size. Annual surveillance audit: $3,000–$8,000. The financial benefits analysis from Advisera indicates ISO 14001-certified companies consistently achieve lower regulatory compliance costs and faster permit approvals — operational savings that offset certification investment within 2–3 years.
Cradle to Cradle Certification: What It Means for Tube Manufacturers
Cradle to Cradle (C2C) Certified® is the most comprehensive sustainability certification available for manufactured products. It assesses five categories: material health, material reutilization/circularity, renewable energy and carbon management, water stewardship, and social fairness. Certification is awarded at four ascending levels: Bronze, Silver, Gold, and Platinum.
For tube packaging manufacturers, C2C certification is a premium differentiator — it is the certification that major luxury cosmetic brands and pharmaceutical companies with advanced sustainability programs look for when selecting packaging suppliers who will feature in their brand sustainability communications. Recertification is required every three years, ensuring ongoing relevance rather than a one-time compliance check.
The Cradle to Cradle Products Innovation Institute provides the full certification process documentation.
EU Packaging Directive Compliance and What’s Required
Under EU Regulation 2025/40 (PPWR), packaging placed on the EU market from August 2026 must meet defined recyclability criteria — not theoretical recyclability, but recyclability at scale based on waste management infrastructure across EU member states. Tube packaging specifically will be subject to:
- Mandatory recyclability assessment and labeling
- Phase-in of minimum recycled content requirements (starting 2030)
- Extended Producer Responsibility fees calibrated to packaging environmental performance (eco-modulation)
- Restrictions on the use of hazardous substances in packaging materials
Manufacturers supplying into the EU market through distributors or directly need to complete a recyclability assessment for each tube format they supply — and that assessment needs to be documented, not assumed.
Product Testing Standards for Sustainable Tube Materials
Barrier Property Testing for Biodegradable and Alternative Materials
Every sustainable material switch requires the same barrier property documentation as the conventional material it replaces — but bio-based and compostable materials often show more variability between production lots than conventional polymers, because their feedstocks vary more. Build lot-to-lot barrier property testing into your incoming material inspection protocol for bio-based materials, not just the initial qualification batch.
OTR testing (ASTM D3985 or ASTM F1927): Test each incoming lot at the temperature and humidity conditions relevant to your product’s storage and distribution environment.
WVTR testing (ASTM F1249): Particularly critical for PLA, which has higher moisture vapor transmission than conventional PE at equivalent thickness.
Seal integrity testing: Bio-based materials often require different seal jaw temperature profiles than conventional PE — establish the specific parameters through FAT (Factory Acceptance Testing) before committing to production qualification.
Safety and Compatibility Testing for Pharmaceutical and Cosmetic Products
Switching from a conventional to a sustainable tube material for a pharmaceutical or cosmetic application triggers the requirement for a formal compatibility study — as detailed in FDA 21 CFR §211.94 for pharmaceutical applications and EU Regulation 1223/2009 for cosmetic applications.
For bio-based polymers, the extractables profile may differ from conventional polymer equivalents because the residual monomer and catalyst chemistry of bio-based production routes differs from petrochemical routes. Run a full extractables and leachables assessment on any new bio-based tube material before accepting it for pharmaceutical production — do not assume that a bio-based PE has an equivalent E&L profile to fossil-derived PE simply because the polymer chain structure is identical.
Shelf-Life Validation With New Sustainable Materials
The timeline for shelf-life validation with new materials: 3–6 months minimum for initial data generation, 12–36 months for full real-time study completion depending on claimed shelf life. The business implication: material selection and stability study initiation should happen 12–18 months before the planned commercial launch date for any product requiring sustainable material packaging, to ensure compliance documentation is available before the product reaches market.
Communicating Compliance to Your Market
Transparent Labeling That Proves Your Sustainability Claims
Regulators and courts have clarified what “transparent” means for sustainability claims in packaging: specific, measurable, verified, and qualified. Compare these:
- Non-compliant: “Eco-friendly tube” (vague, unverified, no specific claim)
- Non-compliant: “Made from recycled materials” (no percentage, no certification)
- Compliant: “Tube made from 50% post-consumer recycled PE, verified by [Certification Body]”
- Compliant: “Tube material certified compostable in industrial composting facilities. Check local composting infrastructure.”
The FTC Green Guides and EU Green Claims Directive (in implementation) both require claims to be substantiated, specific, and truthful. Distributors and agents who help their manufacturing customers frame their sustainability claims correctly are providing compliance risk management, not just sales support.
How Agents and Distributors Can Leverage Your Compliance Achievements
Distributors carrying certified tube packaging machinery can use their manufacturers’ certifications as a direct sales tool: “This machine is compatible with ISO 14001-compliant production systems, supports PCR material processing for which documentation templates are available, and integrates with batch recording systems that generate the environmental performance data your customers need for sustainability reporting.” That is a specifications conversation, not a sustainability generality.
Building Partnerships and Supply Chain Resilience
Finding and Vetting Sustainable Material Suppliers
Supplier Evaluation Criteria for Sustainable Tube Materials
The criteria for qualifying a sustainable material supplier extend beyond those for conventional materials:
Feedstock transparency: Bio-based materials require documentation of feedstock origin — which crop, from which geography, under which agricultural certification (ISCC, RSB, or equivalent for bio-based content claims). Without this documentation, the bio-based content claim cannot be substantiated.
Batch-to-batch consistency: Bio-based polymers can show more mechanical property variability between production lots than petrochemical polymers. Request data from 12 consecutive commercial production lots before qualification — not just the three-lot data package that is standard for conventional materials.
End-of-life pathway documentation: A material supplier claiming their product is recyclable or compostable should provide: which specific certification standard was met, which certification body verified it, which waste management infrastructure can process the material, and in which geographic markets that infrastructure exists at commercial scale.
Long-Term Partnership Strategies That Ensure Material Consistency
The bio-based materials supply chain is less consolidated than the conventional polymer supply chain. There are fewer suppliers, lower total production volumes, and more sensitivity to agricultural commodity disruptions. The risk management response is: qualify more suppliers per material than you would for conventional materials, maintain more safety stock, and build contract terms that specify both minimum supply quantities and maximum price escalation.
Risk Management: Securing Supply Chains for Emerging Sustainable Materials
Supply chain risk for sustainable materials is primarily: availability risk (production capacity constraints), quality consistency risk (feedstock variation), and price volatility risk (agricultural commodity correlation). Address all three in supplier contracts: volume guarantees (minimum monthly quantity the supplier will allocate), specification guarantees (maximum acceptable lot-to-lot variation in key properties), and price stabilization mechanisms (index linkage with defined maximum adjustment frequency).
Collaborating With Equipment Manufacturers and Distributors
Selecting Machinery Partners Who Understand Sustainability Goals
A machinery partner who understands sustainability is one who can answer specific questions: “What is the energy consumption of this machine at 80% capacity utilization? What bio-based materials have been production-validated on this platform? What documentation does this machine generate for environmental performance reporting?” A partner who responds with general sustainability statements rather than specific data is not a sustainability partner — they are a machinery vendor with a green marketing message.
Miyoda Packaging Machinery develops tube production equipment with explicit compatibility for PCR materials, documented energy consumption specifications, and design features — servo-driven systems, precision laser diameter control, closed-loop cooling — that directly address waste reduction and energy efficiency objectives. The full tube production machine range includes equipment designed for both standard and sustainable material processing with documented performance data.
For distributors and agents, carrying machinery with documented sustainable material compatibility is a product differentiation — the ability to tell a pharmaceutical or cosmetic manufacturing customer “this machine processes your PCR tubes without quality compromise, and here is the energy consumption data for your ESG report” is a material commercial advantage over competitors selling undocumented machines.
Technical Support Requirements for New Sustainable Materials
When a customer switches to bio-based or recycled tube materials, the first production runs on the new material will require parameter adjustment relative to the validated conventional material settings. Equipment suppliers need to be prepared to provide remote or on-site support for that initial parameter optimization — not just a machine manual with parameter ranges. Confirm before purchase that your equipment supplier has production experience with the specific sustainable material your customer is transitioning to, and can reference field-demonstrated processing parameters from comparable installations.
Building Distributor Networks Around Your Sustainability Vision
For distributors building territory portfolios around sustainable tube packaging machinery, the selection criteria for manufacturing partners should include: documented PCR material compatibility, energy consumption data for ESG reporting purposes, and certified sustainable tube material qualification records from comparable customer installations. These are the three data points pharmaceutical and cosmetic manufacturing customers are most frequently requesting before equipment purchase decisions in 2025.
Industry Networks and Knowledge Sharing
Industry Associations Focused on Sustainable Packaging
The Sustainable Packaging Coalition (SPC) publishes annual trend reports and hosts the How2Recycle labeling program — the most recognized recyclability communication standard in North American consumer packaging. The Cosmetics Europe association provides EU regulatory update tracking specifically for cosmetic packaging. The PDA (Parenteral Drug Association) covers pharmaceutical packaging sustainability compliance.
Membership in one or more of these organizations provides regulatory intelligence, peer access for knowledge sharing, and in some cases co-development opportunities with brands and retailers on emerging sustainability standards.
Measuring Success and Continuous Improvement
Key Performance Indicators for Sustainable Tube Manufacturing
Measuring sustainability performance requires metrics that are specific, regularly tracked, and tied to operational decisions rather than annual reporting exercises.
Waste Reduction Metrics That Matter to Your Bottom Line
Track these monthly:
- Material utilization rate: (Saleable tube output in kg) ÷ (Total material input in kg) × 100. Target: above 97% for best-in-class operations.
- First-pass yield rate: (Tubes passing all quality checks without rework) ÷ (Total tubes produced) × 100. Target: above 99% for pharmaceutical; above 98.5% for cosmetic.
- Changeover waste per format change: Total material purged per format change in kg. Track trend quarterly; set annual reduction targets.
- Ink utilization efficiency: (Ink consumed in finished product) ÷ (Total ink purchased) × 100. Target: above 88% with closed-loop ink recovery systems.
Material Efficiency Ratios and How to Track Them
The material efficiency ratio (MER) is calculated as:
$$\text{MER} = \frac{\text{Saleable output (kg)}}{\text{Total material input (kg)}} \times 100$$
An MER below 95% indicates significant waste that can typically be reduced through process optimization. An MER above 98% indicates a well-optimized line. Track MER by material type — bio-based materials often show lower initial MER than conventional materials during the production learning curve of the first 3–6 months of operation, then converge to or exceed conventional material MER as operators build process knowledge.
Carbon Footprint Reduction Targets and Measurement Methods
Scope 1 and Scope 2 carbon emissions for a tube manufacturing facility are calculated from: energy consumption by source (electricity, natural gas, fuel oil), multiplied by the relevant emission factor for each source. For electricity, use the IEA grid emission factor for your national grid. Set a defined reduction target (5–10% annual reduction is achievable through energy efficiency improvements and equipment upgrades without production reduction) and track progress monthly against baseline.
Communicating Results to Stakeholders
Sustainability Reporting for Customers, Investors, and Regulators
An annual sustainability report documenting: material waste reduction achieved, energy consumption per unit output, PCR content percentage by product line, and certifications held provides the evidence base customers need for their own sustainability reporting. Under the EU’s Corporate Sustainability Reporting Directive (CSRD), companies above defined size thresholds must publish verified sustainability data — and their suppliers’ data feeds into that reporting. Being the supplier who already has the data in reportable format is a retention advantage.
Case Studies Demonstrating Your Waste Reduction Achievements
Documented, specific case studies are the most effective sales tool for sustainability-related machinery or tube product sales. A case study that states “this customer reduced scrap from 2.8% to 0.6% using our equipment, generating annual material savings of $87,000 and reducing EPR fee exposure by €42,000” is infinitely more persuasive than a general sustainability capability statement.
Build one case study per major customer segment (pharmaceutical contract packer, cosmetic OEM, private label cosmetic) annually. Make these available to your distributors and agents as sales support materials.
Planning for Continuous Improvement
Annual Sustainability Audits and Gap Analysis
An annual sustainability audit — assessing your current performance against defined targets, industry benchmarks, and evolving regulatory requirements — identifies the highest-priority improvement opportunities for the following 12 months before they become compliance gaps. Use published benchmarking data from industry associations and peer publications to calibrate your targets against what comparable operations are achieving.
Staying Current With Emerging Technologies and Materials
The sustainable materials landscape in 2025 is moving faster than it did in 2020–2022. New bio-based polymer grades, improved recycled content processing technologies, and novel paper-plastic composite constructions are entering commercial viability at a pace that means a material that was technically or economically unattractive 18 months ago may be a viable option today. Build a quarterly material technology review into your new product development process — not to adopt every emerging material immediately, but to maintain awareness of what is available and at what performance and cost point.
Scaling Successful Waste Reduction Initiatives Across Your Facility
A waste reduction initiative that delivers proven results on one production line should be standardized and transferred to all equivalent lines — the work of documentation, parameter optimization, and staff training is already done on the first line. The scaling investment is primarily management attention and training time, not additional capital. Manufacturers who systematically scale successful innovations achieve cumulative improvement rates two to three times higher than those who treat each line as a separate improvement project.
Overcoming Common Implementation Challenges
Addressing Cost Concerns Without Compromising Quality

Myth-Busting: Sustainable Doesn’t Always Mean More Expensive
The most persistent barrier to sustainability transition is the assumption that sustainable always means more expensive. The data in 2025 does not support this as a universal truth:
Bio-PE at 3–7% premium over fossil PE — with EPR fee savings and brand premium pricing, often net-zero or net-positive within 18 months.
PCR PE at 5–12% premium over virgin PE — but PCR PE qualifies for EPR eco-modulation discounts in EU markets, partially or fully offsetting the material cost premium.
Waste reduction savings: Moving from 2.5% to 0.4% rejection rate on a 30,000-tube-per-day line saves $22,000–$55,000 annually — from equipment optimization, not material switching.
Energy reduction: Servo-driven equipment saving 25% energy on a two-shift operation generates $6,000–$14,000 annual saving.
The complete cost picture — material cost change plus waste reduction saving plus energy saving plus EPR fee impact plus revenue impact from premium positioning — almost always shows a net improvement over the status quo within 18–24 months.
Strategies for Managing Transition Costs and Budget Constraints
Phase the transition to manage capital outflow. A phased approach:
Phase 1 (Months 1–3, low capital): Implement process optimizations (start-up protocols, staff training, ink recovery) that reduce waste with minimal capital. Use the savings to fund Phase 2.
Phase 2 (Months 3–8, medium capital): Retrofit targeted equipment modifications (temperature controllers, check-weighers) using Phase 1 savings. Use the additional savings to fund Phase 3.
Phase 3 (Months 8–18, significant capital): Invest in new or significantly upgraded equipment using accumulated savings and, where applicable, green financing instruments (see below).
Financing Options for Equipment and Material Upgrades
Green financing is increasingly available for manufacturing equipment investments that deliver documented environmental improvement:
Green term loans: Banks offering sustainability-linked lending (typically 20–50 basis points below standard rates) for equipment with documented energy efficiency improvements. Most major commercial banks have these products; qualifying requires energy consumption documentation before and after upgrade.
Equipment leasing: Capital-preserving alternative to outright purchase for manufacturers with constrained capex. Monthly lease payments are funded from the monthly operational savings the equipment generates, often achieving cash-flow positive operation from Month 1.
Government sustainability grants: Multiple national governments — particularly in the EU, UK, and Singapore — operate grant programs for manufacturing equipment upgrades that reduce energy consumption or material waste. Eligibility varies by program; worth reviewing with your national business development agency before finalizing equipment financing.
Solving Technical and Production Issues
Troubleshooting Common Problems When Switching to Sustainable Materials
Bio-based material processing temperature variance: PLA and PHA require lower processing temperatures than LDPE (typically 30–50°C lower). Running bio-based materials at LDPE-optimized die temperatures causes thermal degradation that generates both quality failures and unpleasant odor. Solution: Run a documented temperature profile optimization with your equipment manufacturer before first commercial production. Never use LDPE recipes as a starting point for bio-based material processing.
PCR material consistency variation: Post-consumer recycled PE shows more lot-to-lot variation in melt flow index (MFI) than virgin PE because PCR is a blend of materials collected from multiple sources. MFI variation causes fill weight and seal integrity variation. Solution: Narrow your PCR material specification to a tighter MFI range than you would specify for virgin PE, and perform incoming MFI testing on every lot before release to production.
Paper composite tube seal zone weakness: Paper composite tubes require different sealing system configuration than plastic tubes — lower jaw temperature, shorter dwell time, and often different jaw geometry to accommodate the paper layer’s compressibility. Solution: Run a dedicated sealing parameter qualification for each paper composite tube format before commercial production.
Minimizing Production Disruptions While Implementing Changes
The parallel production approach — running both conventional and sustainable lines simultaneously during the transition — is the only strategy that fully protects customer supply continuity. It requires temporary capacity of approximately 25–30% above steady-state production to accumulate the safety stock that covers the transition period, but eliminates the risk of customer supply gaps that damage relationships built over years.
Communicate your transition timeline to customers proactively. Most pharmaceutical and cosmetic buyers will provide extended lead time and increased order flexibility during a supplier transition that improves their own sustainability position — because the transition also improves their supply chain sustainability reporting.
Managing Change Across Your Organization
Building Internal Buy-In for Sustainability Initiatives
Sustainability transitions fail not because of technical problems but because of organizational resistance. Production teams who have been optimizing conventional material processes for years reasonably view process changes as disruption risk. The most effective approach to building buy-in is not top-down mandate but shared economic argument: show the production team the waste data from their own line, the direct link between the waste data and the sustainability investment, and the performance improvement they will see in first-pass yield rates after the transition. A team that understands the connection between their daily quality performance and the sustainability investment is a team that supports the transition.
Creating a Sustainability Culture That Drives Continuous Improvement
Organizations with genuine sustainability cultures — where environmental performance is tracked, discussed, and improved with the same discipline applied to quality and production output — consistently outperform those where sustainability is a communications function rather than an operational one. The indicators of a genuine sustainability culture: waste data is reviewed in weekly production meetings, energy consumption is tracked per machine per shift, and new product development routinely includes sustainable material evaluation as part of the specification process — not as an optional add-on.
Your Pathway to Sustainable Tube Packaging Leadership
2025 is the year the sustainability transition in tube packaging shifts from optional to operational. The regulatory frameworks that make sustainable packaging compliance mandatory — EU PPWR, expanding EPR schemes, recycled content mandates — are no longer future-dated proposals. They are enacted law with defined timelines.
The manufacturers who complete this transition first will spend the next 18–24 months building customer relationships, supply chain infrastructure, and certification documentation that will be genuinely difficult for later-moving competitors to replicate quickly. The manufacturers who wait will spend those same 18–24 months scrambling to qualify materials, adapt equipment, and build documentation packages while their customers are already asking “when will you be certified?”
The business case for sustainable tube packaging is not a values argument — it is a margin protection argument, a customer retention argument, and a market access argument simultaneously. Waste reduction generates direct savings. EPR fee optimization reduces regulatory cost. Sustainability certification opens customer portfolios that are closed to non-certified suppliers. Premium material positioning enables pricing that offsets material cost premiums.
The manufacturers, distributors, and machinery agents who combine the right material choices with the right equipment specifications and the right compliance documentation structure will turn their sustainability investment into a durable competitive position.
For equipment guidance, technical consultation on sustainable material compatibility, or a review of your current production line’s waste profile, Miyoda Packaging Machinery works directly with cosmetic and pharmaceutical tube manufacturers to specify equipment that supports both current production requirements and sustainable material transitions. Review the tube production machine range for equipment specifications including PCR compatibility, energy consumption data, and sustainable material processing capability — or contact the team directly for a production assessment tailored to your specific operation.
Take the First Step Toward Sustainable Tube Packaging Leadership
Your path to sustainable tube packaging starts with understanding exactly where your current operation stands — and the gaps between where you are and where your customers and regulators are heading.
📋 Schedule a production waste assessment: Our technical team reviews your current scrap data, energy consumption, and material specifications to identify the highest-ROI improvement opportunities for your specific line. Contact Miyoda Packaging Machinery →
📥 Download the Sustainable Tube Packaging Readiness Assessment: Benchmark your current sustainability performance against industry standards across material selection, equipment capability, certification status, and documentation readiness. Explore the full machinery range →
🤝 Connect with our equipment and material partner network: Access a curated network of sustainable material suppliers, recycling partners, and certification bodies who work specifically with cosmetic and pharmaceutical tube manufacturers.
📺 Join our upcoming webinar: 2025 Compliance and Profitability — Strategies for Sustainable Tube Manufacturers. Practical guidance on regulatory timelines, material selection, and financial modeling for your sustainability transition.
Glossary of Key Terms
PCR (Post-Consumer Recycled): Material recovered from products that consumers have finished using and deposited in recycling collection systems. Distinguished from PIR (Post-Industrial Recycled), which is production scrap recycled before it reaches consumers. Only PCR content qualifies toward most regulatory recycled content requirements.
EPR (Extended Producer Responsibility): A policy framework that makes producers financially responsible for the end-of-life management of the products and packaging they place on the market. EPR fees are typically collected through national producer responsibility organizations and fund collection and recycling infrastructure.
OTR (Oxygen Transmission Rate): The rate at which oxygen permeates through a packaging material, measured in cm³/m²/day. Lower OTR provides better protection for oxygen-sensitive formulations.
WVTR (Water Vapor Transmission Rate): The rate at which water vapor permeates through a packaging material, measured in g/m²/day. Critical for both moisture-sensitive and moisture-containing formulations.
PHA (Polyhydroxyalkanoate): A family of bio-based polymers produced by microbial fermentation. Biodegradable in both industrial composting and marine environments. Current leading candidate for drop-in replacement of conventional PE in bio-based tube applications.
PLA (Polylactic Acid): A bio-based polymer derived from corn or sugarcane. Biodegradable under industrial composting conditions (above 55°C). Not biodegradable under home composting or ambient conditions. Requires specific labeling under FTC Green Guides and EU Green Claims Directive.
PPWR (EU Packaging and Packaging Waste Regulation 2025/40): The EU regulation that replaces the previous Packaging and Packaging Waste Directive, entering into force February 2025 and applying from August 2026. Introduces recyclability requirements, minimum recycled content mandates, and EPR eco-modulation.
ISO 14001: International standard for Environmental Management Systems, certifying that an organization has a documented and continuously improved system for managing its environmental impacts. Process certification, not product certification.
Cradle to Cradle (C2C) Certified®: A comprehensive product sustainability certification assessing material health, circularity, renewable energy, water stewardship, and social fairness across four certification levels (Bronze, Silver, Gold, Platinum).
MFI (Melt Flow Index): A measure of the flowability of a melted polymer under defined temperature and pressure conditions. Critical specification for tube extrusion — MFI variation between material lots causes processing parameter drift and quality variability.
ASLT (Accelerated Shelf-Life Testing): Testing conducted at elevated temperature and humidity conditions (typically 40°C/75% RH) to predict long-term product stability in compressed time. Required when switching primary packaging materials for pharmaceutical or cosmetic products.
Frequently Asked Questions
FAQ 1: What is the real difference between biodegradable and compostable tube materials — and why does it matter for my labeling?
“Biodegradable” means a material breaks down through biological processes over some undefined timeframe in some environment. It is a non-specific term that regulatory bodies including the FTC explicitly identify as likely to mislead consumers if used without qualification. “Compostable” is a specific, testable claim: the material breaks down within a defined timeframe (typically 180 days) under specific conditions. Industrial compostable materials (certified to EN 13432 or ASTM D6400) require processing temperatures above 55°C — not achievable in home composting. Home compostable materials meet the higher standard of biodegrading under ambient conditions.
For pharmaceutical and cosmetic tube manufacturers, this distinction determines your labeling, disposal infrastructure requirements, and regulatory exposure. Using “biodegradable” without qualification on packaging in the EU risks enforcement action under the emerging Green Claims Directive. Using “compostable” without specifying “industrial composting facility required” violates FTC Green Guides in the US. The accurate, compliant label specifies: the certification standard met, the certification body that verified it, and the type of composting infrastructure required. This is not more complicated than a vague claim — it is just specific.
FAQ 2: Will switching to sustainable tube materials significantly increase my production costs?
The cost impact varies by material choice, volume, and market. Current pricing premiums: aluminum tubes 10–15% above plastic equivalents; bio-PE 3–7% above fossil PE; PCR PE 5–12% above virgin PE; PHA 12–20% above equivalent PE. These are material cost premiums only — they do not account for the offsetting factors.
EPR eco-modulation in EU markets reduces fees for more recyclable materials — the fee saving partially or fully offsets the material cost premium for recyclable aluminum versus non-recyclable plastic laminates. Waste reduction from equipment optimization — separate from material cost — saves most manufacturers 3–6% of revenue in reduced scrap and rework. Brand premium positioning enables 8–15% price uplift in EU markets for products in documented sustainable packaging. When all factors are netted, most manufacturers operating in EU-market-serving supply chains find sustainable tube materials cost-neutral or net-positive within 18 months. The 18–24 month payback timeline is an industry average across reported implementations.
FAQ 3: Can biodegradable tubes actually hold up to the shelf-life requirements for pharmaceutical products?
Modern bio-based polymers can meet pharmaceutical shelf-life requirements for many, but not all, formulations. The barrier properties of current generation PHA are adequate for moderate-barrier applications (topical creams, ointments, most gels) but not for high-barrier applications where aluminum or PE/EVOH laminate is currently specified. The answer depends entirely on your specific formulation’s stability requirements.
The protocol for determining compatibility: run accelerated shelf-life testing (ASLT) at 40°C/75% RH for six months with your actual formulation in the candidate bio-based tube, testing the critical quality attributes (assay, pH, appearance, microbial count) at defined intervals. If the product remains within specification at six months of accelerated conditions, you have initial data supporting a shelf-life claim for most regulatory submission purposes. This testing must be completed before commercial production — not after market launch. Budget 3–6 months and $15,000–$50,000 per formulation-material combination for this validation.
FAQ 4: What equipment changes do I actually need to make to produce sustainable tube packaging?
Equipment needs are material-specific, not universal. Bio-PE (drop-in replacement): typically processable on existing PE extrusion equipment with minor die temperature profile adjustment — verify with your equipment manufacturer, but major capital investment is rarely needed. PCR PE: compatible with most existing extrusion equipment; the key requirement is incoming MFI testing to manage lot-to-lot variability. PHA/PLA: requires lower processing temperatures (30–50°C below LDPE) and may require die modification for optimal processing; run a material compatibility assessment before purchasing material at commercial volumes. Paper composite tubes: require different sealing jaw configuration and different filling system calibration — these are parameter changes, not full machine replacements in most cases. Aluminum tubes: require different machinery entirely (collapsible aluminum tube production is a distinct process from plastic tube extrusion).
Before committing to any sustainable material, conduct a technical assessment of your current equipment with your machinery supplier. This assessment identifies which materials are processable with parameter changes, which require targeted modification, and which require new equipment — and gives you an accurate capital plan before purchase commitments are made.
FAQ 5: How do I protect my brand from greenwashing accusations when marketing sustainable packaging?
Third-party certification is the primary protection. Specific, measurable claims backed by documented, verifiable data are the operational standard. Avoid vague terms entirely: “eco-friendly,” “green,” “natural,” “sustainable” without qualification are all potential enforcement targets under FTC Green Guides and EU Green Claims Directive. Replace them with specific claims: “Tube made from 50% PCR PE certified by [Organization],” “Industrial compostable material, certified to EN 13432 by TÜV Austria,” “Recycling rate 85% in EU sortation systems, per GmbH assessment.”
Annual third-party audits of your sustainability claims — comparing documented performance against marketing claims — provide an ongoing verification record that is defensible in regulatory and customer audit contexts. For distributors carrying your products, the certification documentation is what they need to confidently represent your sustainability position to their customers. Provide certification certificates, test reports, and data summaries as standard sales support documents — not as information available only on request.
FAQ 6: What is a realistic timeline for implementing sustainable tube packaging across my whole operation?
A phased 6–18 month transition is realistic for most mid-size operations. Phase 1 (Months 1–3): Conduct your production waste audit; initiate material qualification testing for your target sustainable material; begin ISO 14001 pre-assessment if not already certified. Phase 2 (Months 2–5): Run parallel production trials of sustainable material alongside conventional production — this is accelerated stability testing time; it is not wasted production time. Phase 3 (Months 4–9): Equipment modification or procurement based on Phase 2 trial data; staff training on new material handling and processing parameters. Phase 4 (Months 9–18): Full-scale commercial production in sustainable material for qualified SKUs; maintain conventional production for SKUs still in stability testing. Phase 5 (Ongoing): SKU-by-SKU transition as stability data completes.
Start with your highest-volume SKUs — they generate the most rapid payback and provide the operational scale to validate the transition before extending to lower-volume formats. Working with an experienced equipment and material partner who has executed comparable transitions with similar tube formats can compress this timeline by 30–40% compared to first-time independent implementation.
FAQ 7: How do I keep customer supply running during the material transition period?
Build a safety stock buffer before the transition begins. Target 6–8 weeks of safety stock in the conventional material before switching — this buffer absorbs any production variation during the learning curve of the new material without affecting customer delivery performance. Communicate the transition timeline to customers at least 90 days in advance. Most pharmaceutical and cosmetic buyers have no objection to a sustainable packaging transition, but they do have objections to supply interruptions. The 90-day notice allows them to build their own safety stock if needed and adjust their production planning.
For pharmaceutical customers specifically, a change in primary packaging material triggers a regulatory notification requirement in most markets (a CBE-0 or CBE-30 filing in the US, depending on the risk level of the material change; a Type IA or IB variation in the EU). Factor this notification timeline into your transition plan — the regulatory notification process must be completed before you ship commercial product in the new material.
FAQ 8: Which sustainable tube material is the best fit for my specific cosmetic or pharmaceutical product?
There is no universal answer. Here is the selection framework: First, determine the critical barrier requirement for your formulation — if oxidation is the primary stability risk, you need high oxygen barrier (aluminum or PE/EVOH); if moisture migration is the issue, you need high moisture barrier (aluminum or WVTR-specific bio-based film). Second, identify the end-of-life pathway available in your primary market — a material that is genuinely recyclable in Germany may not be recyclable in Malaysia; match material choice to market infrastructure. Third, establish your budget and timeline for stability validation — materials that require new stability studies impose a 3–6 month data generation timeline before commercial launch.
The decision matrix outcome by category: pharmaceutical topicals (high OI sensitivity) → aluminum or PE/EVOH; cosmetic serums and actives → PHA or aluminum; body care (low sensitivity) → PCR PE or bio-PE; oral care → PCR PE (aluminum for premium); decorative packaging → paper composite (dry contents only). For a specific formulation assessment, a compatibility testing protocol developed with your material supplier and run on your actual formulation provides the data that should drive the final decision.
FAQ 9: What 2025 regulatory changes should I specifically be planning for?
The highest-priority regulatory developments for cosmetic and pharmaceutical tube manufacturers in 2025: EU PPWR (Regulation 2025/40) enters into force February 2025 — begin recyclability assessments now for all EU-destined tube formats; apply from August 2026. US state recycled content laws are active in California, Colorado, Maine, Oregon, and Washington — if you supply into these markets, verify current compliance status immediately. EU Green Claims Directive — currently in negotiation, expected to enter force 2026–2027 — review all sustainability marketing language for specific, verifiable claim compliance now. UK EPR mandatory from April 2025 — producers must be registered and reporting; packaging labeling requirements being phased in.
For pharmaceutical tube manufacturers specifically: USP <661.2> updated requirements for plastic pharmaceutical packaging materials became mandatory December 2025. If your pharmaceutical tube material supplier has not confirmed USP <661.2> compliance, request updated CoA documentation immediately.
FAQ 10: How do I calculate the ROI of a sustainable packaging investment for my leadership team?
Use this four-factor ROI model:
$$\text{Net Annual Benefit} = (\text{Waste Reduction Saving}) + (\text{Energy Saving}) + (\text{EPR Fee Reduction}) + (\text{Revenue Upside}) – (\text{Material Premium}) – (\text{Testing and Certification Cost amortized})$$
Plug in your specific numbers: waste reduction saving from Section 1 waste audit data; energy saving from equipment specifications (20–30% for servo-driven upgrade); EPR fee reduction from recyclability assessment of current vs. target material; revenue upside from brand premium pricing research for your specific market. Material premium from current sustainable material pricing. Testing costs from stability study budget (amortized over 36-month product lifecycle).
Most tube manufacturers running this model for mid-range cosmetic applications in EU-serving supply chains find net annual benefit of $80,000–$250,000 against equipment and transition investment of $45,000–$120,000 — generating payback in 6–18 months. Present the model to leadership with your own data inputs rather than industry averages; the model’s credibility comes from the specificity of the inputs, not the framework.
FAQ 11: What should I look for in my equipment supplier to support a sustainability transition?
Four non-negotiable requirements: documented PCR material processing experience with production data from comparable installations (not just “we can process PCR” — actual MFI range specifications, reject rate data, and energy consumption from operating lines); energy consumption specifications per machine at defined utilization rates (not just marketing energy efficiency claims); technical support commitment for the initial production period with new materials (on-site or remote parameter optimization support during the first production runs); and data output capability for sustainability reporting (energy consumption per shift, material consumption per production run, reject rate documentation in exportable format).
Machinery suppliers who cannot provide all four of these specifically are not sustainability-ready partners — regardless of their marketing positioning. Miyoda Packaging Machinery provides documented PCR compatibility specifications, energy consumption data, and production support for sustainable material transitions as standard elements of the equipment package, not premium add-ons.
FAQ 12: How can I differentiate my business through sustainable packaging beyond just the material?
Differentiation through sustainable packaging has three dimensions that are typically underutilized: process transparency, supply chain documentation, and end-of-life enablement. Process transparency means publishing your waste data, your energy consumption per unit of output, and your year-on-year improvement trajectory — numbers that verifiably document operational sustainability performance rather than material claims alone. Supply chain documentation means providing full traceability from raw material feedstock through your production process to the finished tube — the documentation chain that enables your customers to use your sustainability performance in their own CDP or CSRD reporting. End-of-life enablement means actively partnering with your customers on tube take-back and recycling programs — being the manufacturer who enables the brand’s circular packaging commitment rather than simply supplying a certified material.
Brands are increasingly selecting packaging suppliers not just on material sustainability but on the completeness of the sustainability story their supplier can help them tell. The manufacturer who can provide feedstock origin documentation, production energy data, and a recycling partnership arrangement has a differentiation advantage that a supplier with a certified material but no surrounding documentation cannot easily replicate.
FAQ 13: What testing do I need to complete before launching products in new sustainable packaging?
The testing requirement is determined by the product category and the regulatory framework of your target market. For pharmaceutical products, material switching triggers: extractables and leachables testing (6–9 months); accelerated stability testing at ICH Q1A conditions (6 months minimum); regulatory notification filing before commercial supply; and potentially a formal container closure integrity study if the sealing mechanism changes. Total timeline: 12–18 months. Total budget per SKU: $30,000–$80,000.
For cosmetic products: compatibility testing between the new tube material and the formulation (1–2 months); accelerated stability testing (3–6 months for initial data); safety assessment update if migration testing shows new extractables; regulatory compliance review for each target market’s labeling and material requirements. Total timeline: 3–8 months. Total budget per SKU: $10,000–$30,000. Start testing 12–18 months before planned commercial launch for pharmaceutical; 6–10 months before for cosmetic.
FAQ 14: How do I build a reliable supply chain for sustainable tube materials that won’t interrupt my production?
Supply chain resilience for sustainable materials requires more active management than for conventional materials. Three structural requirements: qualify a minimum of two suppliers per material type (single-source dependency for sustainable materials carries higher risk than for conventional polymers because the supply chains are less diversified); maintain longer safety stock than for conventional materials — 8–10 weeks versus the 4–6 weeks typical for conventional materials; and build contract terms that specify minimum allocation quantities for your volume with maximum price adjustment frequency.
Additionally, join the supply chains of your material suppliers at a level deeper than order placement. Understand their feedstock sourcing, their production capacity relative to market demand, and their expansion plans. Suppliers whose production capacity is committed against growing demand will prioritize volume customers with long-term contracts over spot buyers during supply constraint events — and sustainable material supply constraints are more common than conventional polymer supply constraints.
FAQ 15: What does being an early adopter of sustainable tube packaging actually gain me in competitive terms?
The competitive advantage of early adoption operates on four dimensions simultaneously. First, supplier access: the best sustainable material suppliers are signing long-term supply agreements with early movers — manufacturers entering the market in 2026–2027 will face supply constraints and less favorable contract terms than those securing supply now. Second, customer relationships: cosmetic and pharmaceutical brands with sustainability commitments are building preferred supplier lists now, and manufacturers already certified and supplying sustainable packaging are on those lists in a way that excludes later-moving competitors from specific contracts for 12–24 months. Third, regulatory positioning: manufacturers who complete compliance implementation before regulatory enforcement dates can address the inevitable teething problems without commercial penalty; those who begin at enforcement deadlines are implementing under time pressure that generates costly errors. Fourth, pricing: sustainable packaging currently commands premium pricing in EU and North American markets; by 2027–2028, when sustainability is broadly commoditized and mandatory, that premium will compress. Early movers capture the premium pricing period and build cost competitiveness that sustains margins after the premium compresses.
For distributors and agents: manufacturers with documented sustainability credentials and certified sustainable tube production capability are the easiest suppliers to represent to buyers with sustainability mandates — and the hardest for competing distributors to displace once the relationship is established. Building your portfolio around sustainability-ready manufacturers now is a portfolio strategy, not a values statement.