Why Production Efficiency Is Your Most Profitable Investment Right Now
You don’t need to buy a new machine to make more money from the one you already have.
That statement surprises most cosmetic and pharmaceutical tube packaging buyers the first time they hear it — but the evidence is consistent. A mid-size contract tube manufacturer in Southeast Asia running a fully automatic line at 160 tubes per minute discovered, after a professional baseline audit, that their actual throughput averaged 118 tubes per minute across shifts. The gap — 42 tubes per minute, or roughly 26% of rated capacity — was traced to three fixable problems: a worn seal jaw creating intermittent rejects that operators cleared manually (costing ~8 minutes per hour), a changeover procedure taking 68 minutes that should take 22, and a temperature drift on the filling station that required operators to reduce speed after hour two of every run to maintain seal quality.
Total remediation cost: under $4,000. Annual output gain at $0.11 margin per tube: over $120,000.
That’s the business case for production efficiency — and it’s the reason this guide exists.
The Direct Impact of Output Optimization on Profit Margins
Every tube your machine can produce in a given hour either earns margin or doesn’t. When you’re running at 75% of rated capacity, you’re essentially leaving a quarter of your equipment’s earning potential idle — with the full fixed cost still on the books (machine depreciation, facility overhead, operator wages, energy).
The tube filling machine market was valued at USD 2.1 billion in 2025 and is projected to reach USD 3.1 billion by 2035 at a 3.9% CAGR (Future Market Insights, 2025), reflecting sustained capital investment across cosmetics and pharma. But capital investment alone doesn’t generate returns — optimized operations do.
Manufacturing research consistently shows that production facilities operating with structured optimization programs achieve 15–30% output improvement without additional capital expenditure. At a tube output of 10 million units per year and an average margin of $0.10 per tube, a 20% efficiency gain translates to $200,000 in incremental annual profit from the same facility footprint.
Common Production Bottlenecks That Cost Manufacturers Thousands Monthly
The bottlenecks that drain tube packaging output fall into four predictable categories:
- Unplanned downtime triggered by deferred maintenance — globally costing manufacturers an estimated average of $260,000 per hour of stoppage
- Changeover inefficiency between tube sizes or formulations — industry data shows 15–25% of daily production time lost to poorly managed changeovers (TBM Consulting Group)
- Operator knowledge gaps creating variability between shifts, especially on parameter-sensitive processes like sealing temperature and fill weight
- Suboptimal machine parameters — running a machine at conservative settings “to be safe” rather than at its actual qualified optimal range
Each of these is controllable. The following ten sections show you exactly how.
1. Master Your Machine’s Full Capability
Understanding Your Tube Packaging Machine’s Specifications
Most operators never reach the output levels their machines were designed to deliver — not because the machine can’t perform, but because the team running it doesn’t fully understand what it’s capable of.
A fully automatic cosmetic tube filling machine rated at 200 tubes per minute at the vendor’s factory is not automatically going to deliver 200 tubes per minute on your floor. The rated speed is achieved under controlled conditions — specific tube diameter, wall thickness, fill product viscosity, ambient temperature, and incoming tube quality. Your actual achievable speed depends on how closely your production conditions match those parameters, and on whether your operators know how to adjust the machine’s control settings to compensate when they don’t.
Start by pulling your machine’s technical specification document — not the sales brochure, but the actual IQ/OQ specification used during commissioning. (IQ/OQ/PQ: Installation Qualification, Operational Qualification, Performance Qualification — the three-stage documentation protocol used to certify that a machine is installed correctly, operates within specification, and delivers consistent production performance. Required for pharmaceutical applications; recommended for all regulated cosmetic production.)
Key parameters to locate in that document:
- Rated speed (tubes per minute) at which diameter and fill weight
- Operating temperature ranges for fill station and seal jaws
- Pressure settings for tube clamping and seal pressure
- Fill weight tolerance (typically ±0.5–2% on fully automatic machines)
- Seal strength specification (minimum peel force in N/15 mm)
Conducting a Baseline Performance Audit
Before you can improve output, you need an honest picture of where you are now.
Measure your actual output — in tubes per hour, per shift, per day — against the manufacturer’s rated capacity. If you’re running at 70–80% of rated speed consistently, that gap contains meaningful efficiency potential. If you’re at 85%+, you’re already in the high-performance zone — incremental gains exist but require more precise diagnostic work.
Track three metrics for two full production weeks before making any changes:
| Metric | What It Tells You | Target Benchmark |
|---|---|---|
| Tubes produced per shift | Actual vs. rated output gap | ≥85% of rated speed |
| Unplanned stops per shift | Maintenance and reliability status | <3 per 8-hr shift |
| First-pass yield rate | Quality control and material efficiency | ≥97% |
(OEE — Overall Equipment Effectiveness: the composite measure of production line performance. OEE = Availability × Performance Rate × Quality Rate. World-class OEE benchmark is 85%. Pharmaceutical packaging industry average is 70%. If you don’t know your OEE, you don’t have a complete picture of your machine’s performance.)
Leveraging Advanced Features You Might Be Overlooking
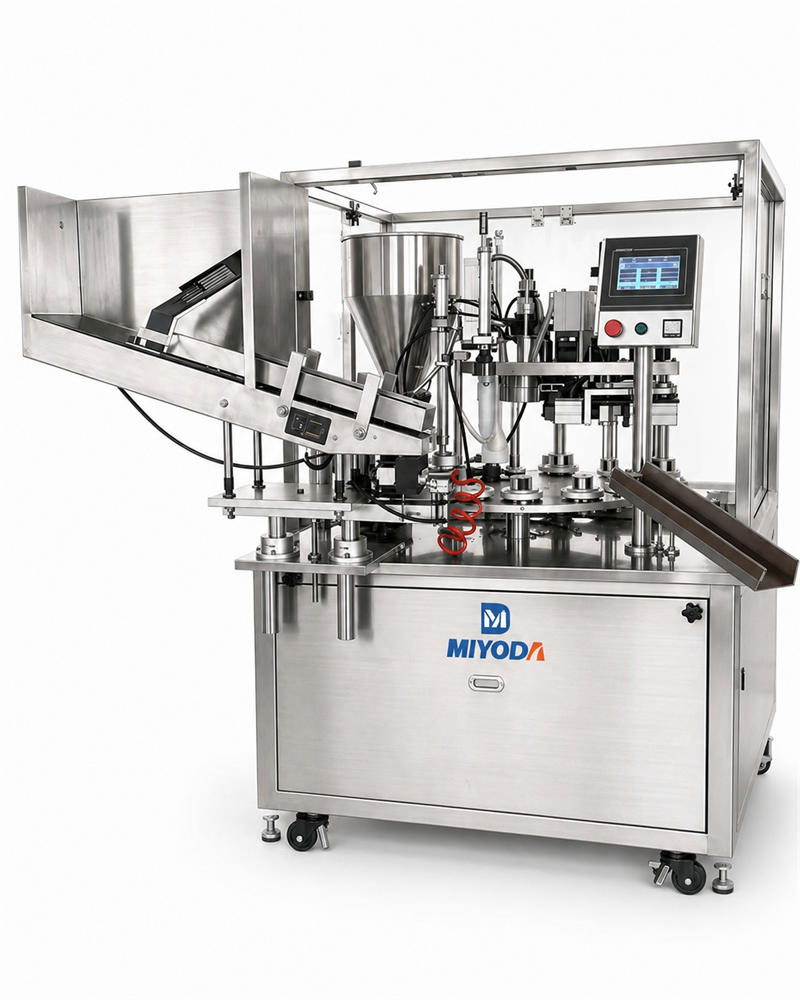
Modern automatic tube filling and sealing machines — including those in Miyoda Packaging Machinery’s tube filling and closing machine range — include automation and control functions that many operators never activate because they weren’t covered in initial training.
Specific features worth auditing on your current machine:
- Recipe storage and recall — allows complete parameter sets (fill weight, seal temperature, pressure, speed) to be saved per SKU and recalled digitally, eliminating manual re-entry errors during changeover
- Automatic speed ramp — gradually increases line speed at startup to allow thermal stabilization, preventing first-run seal quality issues that trigger manual inspection stops
- Fill weight feedback loop — on machines equipped with inline weighing, the control system automatically trims fill volume to maintain weight specification without operator intervention
- Fault logging — records every machine stop with duration and error code; this data is your diagnostic blueprint for identifying the highest-frequency causes of output loss
If your machine has these features and your operators aren’t using them, you have a training gap — not a machine limitation.
2. Implement a Preventive Maintenance Schedule
Why Reactive Maintenance Costs You More Than You Realize
Reactive maintenance — fixing things after they break — is consistently the most expensive maintenance strategy in tube packaging operations. The direct repair cost is typically the smallest part of the total damage.
A seal jaw failure on a 150-tube/minute cosmetic line during a peak production run doesn’t just cost the price of the jaw. It costs: 4–6 hours of downtime while a replacement is sourced and fitted, the output loss (150 tubes/min × 300 minutes × $0.08 margin = $3,600), potential scrap from tubes in the machine at the time of failure, and the cost of expedited customer delivery if the run was against a committed shipment date.
Industry data from packaging line maintenance analysis confirms that 72% of unplanned packaging line stoppages trace directly to components that should have been caught during routine preventive maintenance (OxMaint, 2025) — and that structured PM programs deliver an 11.2× ROI on their implementation cost.
Creating a Maintenance Protocol That Works
The goal is a tiered schedule that catches developing problems before they cause unplanned stops, without creating excessive planned downtime.
Daily Checks (10–15 minutes per shift, before startup):
- Seal jaw condition: inspect for cracks, pitting, or carbon buildup on the seal face
- Fill nozzle integrity: confirm no blockage, wear, or drip after previous shift
- Tube indexing mechanism: verify clean operation and correct timing
- Lubrication points: confirm lubricant level and no evidence of over- or under-lubrication
- Control panel alerts: clear any logged faults from previous shift; investigate codes before starting
Weekly Inspections (1–2 hours):
- Ultrasonic seal horn (if applicable): measure output amplitude against specification; clean transducer face
- Drive belts and chains: check tension and wear; replace if elongation exceeds 2%
- Sensors and proximity switches: verify detection accuracy on all tube-in-position sensors
- Pneumatic system: check pressure regulator setting and air filter condition; drain condensate trap
- Fill weight accuracy: run a timed-production verification against target fill weight
Monthly Deep Maintenance (4–8 hours):
- Full drive system inspection: gearboxes, couplings, bearings; check for abnormal heat, vibration, or noise
- Complete lubrication refresh per manufacturer schedule
- Seal jaw replacement assessment: measure jaw face dimensions against wear limits
- Control system calibration: verify fill weight sensor, temperature sensor accuracy against calibrated reference instruments
- Full machine cleaning: remove product residue, particularly in fill station and tube transfer paths where buildup can affect accuracy and hygiene
Maintaining Seal Quality and Consistency
Seal quality is the most directly customer-visible quality characteristic of a filled tube. A tube that leaks in transit or at point of use is a product failure regardless of fill weight or print quality — and it generates returns, complaints, and brand damage that far exceed the cost of the tube itself.
The two wear items most directly responsible for seal quality degradation are the seal jaw and — for ultrasonic sealing machines — the sonotrode (the ultrasonic horn that transmits vibrational energy to the tube seal). (Sonotrode: a precision-machined titanium or aluminum component that converts electrical ultrasonic energy from a transducer into mechanical vibration at the tube seal interface. Operates at 20–40 kHz. Wear is gradual and causes progressive seal quality decline before catastrophic failure.)
Establish a scheduled replacement cycle for both components based on cycle counts (not time). Most seal jaws on high-speed machines should be inspected at 500,000 cycles and replaced at 1.5–2 million cycles; sonotrodes typically last 3–5 million cycles under correct amplitude settings. Track actual cycle counts from your machine’s production counter — not calendar time.
3. Optimize Your Material Handling Process
Reducing Setup Time Between Production Runs
Changeover time — the period between the last good tube of one production run and the first good tube of the next — is the single biggest controllable efficiency drain in most cosmetic and pharmaceutical tube packaging operations.
Industry analysis using the SMED methodology (SMED — Single-Minute Exchange of Die: a lean manufacturing system for reducing changeover to less than 10 minutes, developed by Shigeo Shingo at Toyota) documents that manufacturers lose 20–30% of total production time to inefficient changeover processes. Structured SMED implementations in packaging environments have achieved changeover time reductions averaging 94% in documented cases — from 90-minute changeovers to under 5 minutes (Lean Production, 2025).
Most tube packaging operations won’t reach 5-minute changeovers due to the complexity of tube size and formulation changes — but moving from 60–75 minute changeovers to 20–25 minutes is consistently achievable with the following approach:
- Separate internal and external changeover tasks. Prepare the next job’s materials, tubes, fill product, and documentation while the current run is still producing — not after the machine stops.
- Standardize the changeover sequence with a documented step-by-step checklist, laminated at the machine. Operators who follow a checklist complete changeovers 30–40% faster than those working from memory.
- Implement quick-change tooling for high-frequency format changes (tube diameter, cap type). Quick-change component systems replace 4–6 bolted components with single-motion locking systems — the difference between a 45-minute tooling change and a 12-minute one.
Selecting the Right Tube Materials for Speed
Not all tube materials run at the same speed on the same machine. Material selection affects production velocity in ways that aren’t always visible until a run is underway.
Fill product viscosity is the primary speed limiter on the fill station. High-viscosity products (thick creams above 50,000 cP, wax-based lip products, dense gels) require longer fill cycles than low-viscosity products, which directly caps line speed regardless of sealing or indexing capacity. If your fill product is above 30,000 cP, work with your fill station supplier to verify pump selection and nozzle diameter against your target fill speed — don’t assume the machine’s rated speed applies to high-viscosity products.
Tube wall thickness and material stiffness affect indexing speed and tube handling reliability. Very thin-wall tubes (below 0.3 mm PE) are more susceptible to deformation during high-speed handling; if your line is experiencing tube jams or orientation errors at speed, wall thickness specification is a frequent cause.
Laminate tube material consistency — specifically the variation in laminate sheet gauge from roll to roll and supplier to supplier — directly affects weld quality on laminate filling lines. If you change laminate material suppliers, re-validate your seal parameters before running production. A seal that holds perfectly at 3.2 N/15 mm on your qualified material may fail burst testing on a new material with 0.1 mm different gauge.
Minimizing Waste and Material Loss
Material waste in tube packaging occurs at three points: fill waste (overfill adjusted by operator or automatic system), tube body waste (rejected tubes from sealing, printing, or handling failures), and changeover waste (tubes and product consumed during startup qualification before the machine reaches stable parameters).
Measure your actual waste rate at each point for one full production month. Even manufacturers who believe their waste is “normal” frequently discover that startup waste — the tubes consumed in the first 10–15 minutes of each run while parameters stabilize — represents 2–4% of total daily material consumption that is entirely preventable with proper recipe recall and thermal pre-stabilization protocols.

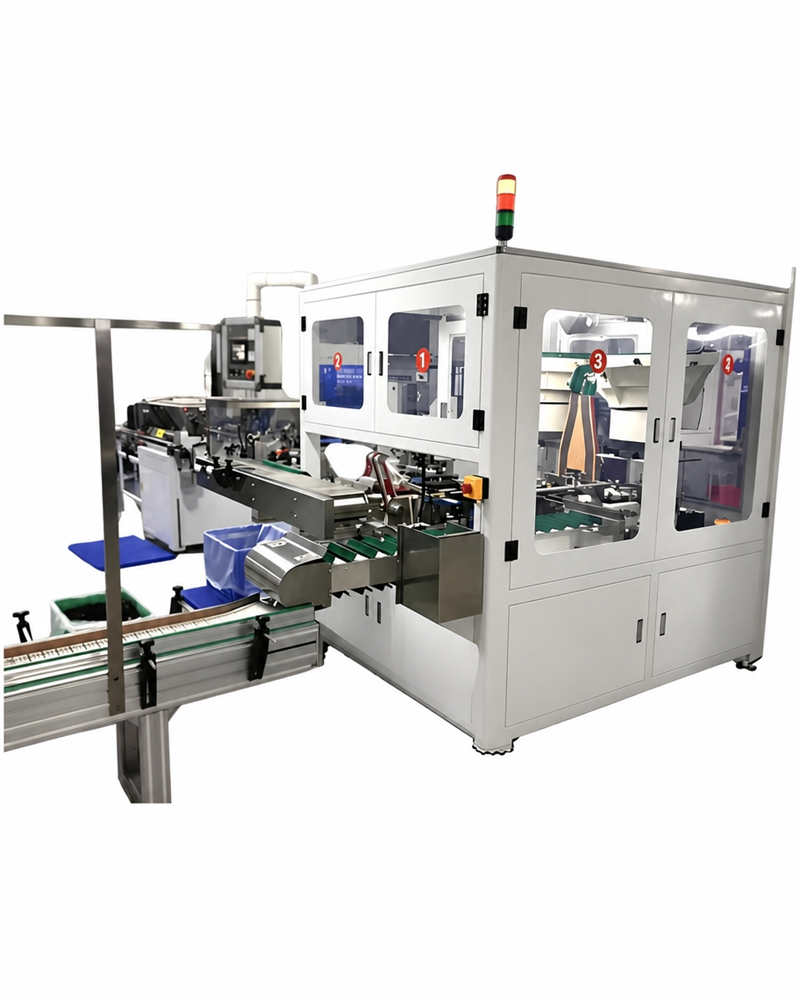
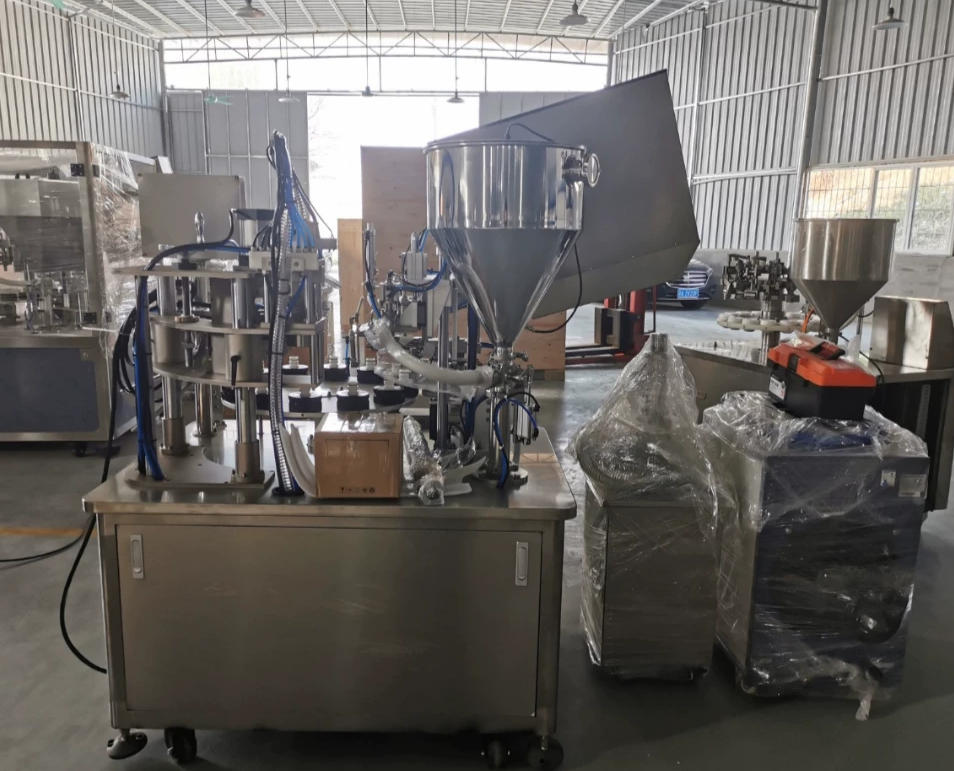
Modern automatic tube filling and sealing machine producing cosmetic cream tubes at high speed — optimized fill parameters and seal jaw maintenance are the two fastest routes to reducing per-tube production cost. Photo: Pexels.
4. Perfect Your Operator Training and Skill Development
Building a Team That Maximizes Machine Potential
The gap between a well-trained operator and an untrained one on an automatic tube filling line is not marginal — it’s structural. Research on operator training impact in packaging manufacturing confirms that well-trained operators achieve 20–35% higher output than untrained staff, with significantly lower quality rejection rates and reduced unplanned downtime (SPS70 Packaging Quality, 2026).
The mechanism is straightforward: a trained operator recognizes the early warning signs of developing problems (slight vibration in the tube indexer, a change in the acoustic profile of the seal unit, a trend in fill weight data moving toward the limit) and intervenes before a minor adjustment becomes a production stop. An untrained operator waits until the machine stops itself — or until customer complaints arrive.
Key competencies every tube packaging operator should be certified on:
- Machine startup and shutdown sequence per SOP (SOP — Standard Operating Procedure: a documented, step-by-step instruction set for completing a specific process consistently, regardless of which operator is performing it)
- Parameter verification and adjustment: fill weight, seal temperature, pressure settings, line speed
- Quality check procedures: visual tube inspection, fill weight verification, seal integrity assessment
- Fault identification: reading and interpreting machine fault codes, basic first-response troubleshooting
- Changeover execution: complete changeover per documented checklist, including qualification tubes
Developing Standard Operating Procedures (SOPs)
SOPs reduce output variability between operators and shifts more effectively than any single machine adjustment. When every operator follows the same documented startup sequence, the same changeover procedure, and the same quality check protocol, your production data becomes consistent enough to identify genuine machine issues rather than operator-to-operator variation masquerading as equipment problems.
Build SOPs for each of these processes first, as they deliver the fastest variability reduction:
- Machine startup and thermal stabilization sequence
- Fill weight verification and adjustment procedure
- Seal quality check: frequency, sampling method, pass/fail criteria
- Changeover: steps, sequence, tooling storage locations, qualification tube count
- Fault response: priority-ranked list of most common fault codes with operator response for each
Laminate the critical SOPs and mount them at the machine. Digital SOP systems are excellent — but when an operator is troubleshooting a seal fault at 2:00 AM, a laminated card at arm’s reach is faster than navigating a software system.
Empowering Operators to Troubleshoot Problems
The financial impact of operator-level troubleshooting capability is measurable: a team that can resolve the 15 most common fault conditions without calling a maintenance technician reduces average stop duration from 25–40 minutes (waiting for the technician, diagnosis, fix) to 5–8 minutes (operator-level rapid response).
On a 150-tube/minute line producing 8 hours per shift, the difference between a 35-minute stop and a 7-minute stop on a fault that occurs twice per shift is:
$$\text{Daily output recovery} = 2 \times (35 – 7) \text{ min} \times 150 \text{ tubes/min} = 8,400 \text{ tubes/day}$$
At $0.09 margin per tube, that’s $756 per day, or approximately $189,000 per year on a single line — from operator training, not capital investment.
5. Fine-Tune Your Production Parameters
Finding the Sweet Spot Between Speed and Quality
Every tube filling and sealing machine has an optimal operating window — a specific combination of line speed, seal temperature, pressure, fill rate, and cooling time at which it produces the best combination of output rate and quality yield. Operating below this window means leaving throughput on the table. Operating above it means generating seal failures, fill weight variation, and tube handling errors that reduce net output even as the machine runs “faster.”
Finding this window requires systematic testing, not guesswork. The methodology:
- Lock all other parameters at your current qualified settings
- Increase line speed in 5% increments
- At each increment, run 500 tubes and measure: seal peel strength, fill weight accuracy (mean and standard deviation), visual rejection rate
- Stop when any quality metric exceeds its specification limit
- Set your production speed at 90% of the limit identified in step 4 — this is your operational “sweet spot” with a 10% safety buffer
Most machines have 10–20% additional speed headroom above their current production setting before quality limits are reached — but that headroom must be validated with your specific product, tube material, and fill formulation, not assumed from a competitor’s experience or a vendor’s claim.
Adjusting Temperature and Pressure Settings
Temperature control is the most sensitive parameter in both hot-air sealing and ultrasonic tube sealing operations.
For hot-air seal systems: seal jaw temperature affects both the bond strength and the cosmetic appearance of the seal fold. Too low, and the seal fails peel testing; too hot, and the tube material discolors, distorts, or produces flash (excess melted material at the seal edge). The optimal temperature window for most PE tube sealing is 170–220°C at the jaw, but this varies with wall thickness, PE grade, and seal dwell time — verify against your specific tube specification.
For ultrasonic sealing systems: the key parameters are sonotrode amplitude (measured in microns, typically 30–60 µm for PE tubes), welding time (0.3–0.8 seconds), and hold pressure during and after the weld cycle. Ultrasonic sealing is more tolerant of ambient temperature variation than hot-air systems, which makes it advantageous in facilities without controlled room temperature — a significant benefit for manufacturers in tropical climates where ambient temperature fluctuates seasonally.
Environmental factors require seasonal parameter adjustment in many facilities. Higher ambient humidity (common in coastal manufacturing locations) affects fill product viscosity and can change the thermal behavior of tube materials. Establish summer and winter parameter sets for your machine if your facility isn’t temperature-controlled — the 3°C ambient temperature difference between January and July can require a 5–8°C seal temperature adjustment to maintain consistent seal quality.
Managing Production Line Flow
A tube filling line doesn’t operate as a single machine — it’s a sequence of stations (tube loading, filling, sealing, cooling, printing if inline, capping, inspection, packing) that must all operate at the same rate to prevent the fastest station from being bottlenecked by the slowest.
Identify your line’s constraining station — the one that limits overall throughput — by measuring actual cycle time at each station. Invest optimization effort in the constraining station first; improving the speed of any non-constraining station by 20% while the constraining station remains unchanged produces zero net output improvement.
Common constraining stations in cosmetic tube lines:
- Fill station for high-viscosity products: limited by pump delivery rate and fill nozzle size
- Seal station for thick-wall tubes: limited by minimum dwell time required for full seal bond development
- Tube loading station on semi-automatic lines: limited by manual operator feed rate
6. Leverage Technology and Monitoring Systems
Installing Real-Time Production Monitoring
You cannot manage what you don’t measure. Real-time production monitoring — at minimum a production counter displaying current tubes per hour against target, with a cumulative shift total — gives operators and supervisors immediate visibility into performance that shifts from guess-based management to data-based management.
Basic monitoring systems can be retrofitted to most existing tube packaging lines for $2,000–$8,000 in hardware and installation. More comprehensive systems tracking temperature, pressure, fill weight, and OEE cost $15,000–$40,000 but provide the data granularity needed to identify subtle performance trends before they become production problems.
The economic justification for monitoring investment is direct: if a monitoring system’s early warning function prevents two unplanned 4-hour stops per year on a 150-tube/minute line, the output value preserved is:
$$\text{Value preserved} = 2 \times 4 \text{ hr} \times 60 \text{ min/hr} \times 150 \text{ tubes/min} \times $0.09 = $6,480$$
Against a monitoring system cost of $8,000, payback is under 18 months — and that calculation doesn’t include the avoided maintenance cost, scrap, and customer delivery risk from the prevented stops.

Real-time production monitoring transforms reactive management into predictive decision-making — operators see performance trends develop before they cause stops. Photo: Pexels.
Using Predictive Analytics to Prevent Issues
Predictive maintenance — using machine data to identify patterns that precede failures, rather than reacting to failures after they occur — is no longer exclusive to large-scale industrial facilities. Modern tube filling machine control systems generate the temperature logs, cycle count data, and fault frequency records needed to support predictive maintenance at modest analytical complexity.
The practical starting point: export your machine’s fault log monthly and identify the top five fault codes by frequency. For each, trace back through the log to identify whether there’s a pattern — does Fault Code E047 (seal pressure low) occur more frequently in week 3 of each production month? After approximately 180,000 cycles? On the night shift? Each pattern is a diagnostic signal pointing toward a specific preventive action.
Research on predictive maintenance in manufacturing environments documents 70–90% reductions in unplanned downtime with properly implemented predictive programs, and 40% reduction in maintenance cost compared to reactive-only approaches. The investment returns within 18–24 months in most industrial applications.
Integrating Quality Control Systems
Inline quality control — automated vision inspection, fill weight verification, or leak detection integrated into the production line — reduces the labor cost of quality checking while simultaneously improving detection reliability compared to sampling-based manual inspection.
For cosmetic tube manufacturers supplying premium brand customers, inline vision systems that inspect print registration, cap alignment, tube body defects, and seal quality at 100% of production — not a statistical sample — are becoming a customer requirement rather than an option. For pharmaceutical tube producers, 100% inline inspection is a GMP expectation in many regulatory frameworks.
Entry-level vision inspection systems for tube lines start at approximately $15,000–$25,000 and integrate via digital output to the machine’s rejection mechanism. The quality data they generate — defect type, defect frequency, trend over time — is also valuable diagnostic information for maintenance and process improvement.
7. Manage Your Supply Chain for Continuous Output
Securing Reliable Material Supply
A tube filling line that’s running efficiently can be stopped entirely by a material shortage. Empty tubes, fill product, caps, or laminate sheet arriving late — or not meeting specification — eliminate every efficiency gain your operations team has worked to achieve.
The most common supply chain-related production disruption in cosmetic tube operations is incoming tube quality variation — tube bodies that don’t meet wall thickness, diameter, or print registration specification, causing higher-than-expected rejection rates on the filling line. Establish an incoming quality inspection protocol for tube bodies: measure 30–50 tubes per incoming lot for wall thickness and diameter; verify print registration on decorated tubes against your approved master standard. Catch non-conforming material before it goes to the line, not after it’s caused a 3-hour rejection cascade.
Maintain a minimum 2-week buffer stock of your highest-volume tube formats and fill product inputs. Buffer stock has a carrying cost — but it’s substantially smaller than the revenue loss from an unplanned line stop caused by a delayed delivery.
Coordinating with Your Equipment Supplier
Your tube machine supplier is a production efficiency resource — not just a sales contact you engaged at purchase. Suppliers with strong after-sales infrastructure can provide remote diagnostics support (video-assisted troubleshooting), technical parameter guidance for new product introductions, and advance notice of spare part availability issues that would otherwise cause emergency procurement situations.
When evaluating your current supplier relationship, ask: How quickly can you get a critical spare part if your seal jaw fails on a Friday? Does your supplier offer remote diagnostic sessions? Do you receive proactive notification about software updates or known wear items approaching end-of-life?
Miyoda Packaging Machinery’s after-sales model — covering remote technical support, a guaranteed spare parts supply, and on-site service for international clients — is designed specifically to address the response-time challenges that cosmetic and pharma manufacturers face when equipment problems occur during peak production periods. Learn more about their full range of tube filling and closing machines and ongoing support structure.
Planning for Seasonal Demand Fluctuations
Cosmetic tube production has predictable seasonal demand cycles: body lotion and moisturizer volumes peak ahead of winter in northern hemisphere markets; sunscreen and after-sun products peak in Q2–Q3; gift set production compresses in September–October ahead of holiday season. Pharmaceutical tube demand is less seasonal but can spike around respiratory illness season for topical pharmaceutical products.
Map your demand curve for the next 12 months by SKU family. Identify your peak production months and calculate whether your current line — at its optimized efficiency rate, not its theoretical maximum — can meet peak demand within your planned shift structure. If the answer is no, plan maintenance and training activities for the shoulder months (the slower periods before peak), not during peak production when downtime has maximum revenue impact.
8. Invest in Strategic Equipment Upgrades
Knowing When to Upgrade vs. Optimize Current Equipment
The default answer to “should I upgrade?” should always be: optimize first.
Until you’ve done a systematic efficiency audit and implementation — covering maintenance, training, parameters, and changeover — you don’t have reliable data on what your current machine can actually deliver. Manufacturers who upgrade without optimizing consistently discover that their new machine suffers the same efficiency losses as the old one, because the problems were operational, not mechanical.
The correct time to evaluate an upgrade is when your optimized line — running at ≥90% of rated capacity with structured maintenance and trained operators — can no longer meet your capacity requirement within your available shift structure, or when the cost of maintaining an aging machine exceeds 20% of its replacement value annually.
A useful comparison framework:
| Scenario | Recommended Action |
|---|---|
| Running at <80% of rated capacity | Optimize before considering upgrade |
| Running at 85–90% of rated capacity | Audit for remaining gains; begin upgrade planning if volume is growing |
| Running at >90% with demand exceeding capacity | Upgrade justified; use efficiency data to specify correctly |
| Maintenance cost >15–20% of machine value/year | Replacement analysis required |
Selecting Add-On Components for Increased Capacity
Before committing to a complete machine replacement, evaluate whether targeted component upgrades can close your capacity gap at a fraction of the cost.
Common high-ROI add-on investments for existing tube packaging lines:
- Automatic tube loader/magazine feeder: eliminates manual tube loading labor on semi-automatic lines; typical cost $8,000–$20,000, typical labor saving 1 operator per shift
- Inline fill weight verification and feedback control: improves fill accuracy and reduces manual check frequency; typical cost $12,000–$25,000
- Quick-change tooling retrofit: reduces changeover time by 50–70% on machines with standard tooling; typical cost $5,000–$15,000 per format range
For guidance on which automation components integrate with your current machine architecture, the Miyoda Packaging Machinery tube filling and sealing machine guide covers the component selection framework for both cosmetic and pharmaceutical applications.
Timing Equipment Investments for Maximum Impact
Schedule machine upgrades, installations, or major planned maintenance during your production calendar’s slowest periods — not during peak demand months.
If your peak production period is October–December (holiday season cosmetics), plan upgrade installation for February–April. If your slowest period is July–August, that’s your maintenance and upgrade window. This timing discipline preserves your peak-season output while allowing proper installation, commissioning, and operator familiarization before your next demand peak.
Coordinate upgrade timing with your capital expenditure cycle. An upgrade decision made in Q4 that requires funding from Q1 budget approval creates a timeline mismatch — the upgrade arrives in May just as your summer peak approaches. Budget and approve capital expenditures one quarter ahead of your intended installation window.
9. Build a Culture of Continuous Improvement
Encouraging Operator Feedback and Innovation
Operators who run a tube filling machine 8 hours per day see performance issues that supervisors and engineers miss. A seal jaw that vibrates slightly at hour 6 of a shift. A tube indexing sensor that occasionally misreads thin-wall tubes. A cap torque that drifts slightly as the cap feeder bowl empties. These are efficiency-relevant observations that operators often don’t report because they’ve been taught to fix problems, not to document them.
Create a simple, non-bureaucratic channel for operators to submit observations: a whiteboard at the machine, a weekly 10-minute team standup, or a basic digital form accessible from the production floor. Review submissions weekly with the maintenance team. Act on at least 30% of submissions within two weeks — this signal tells operators that their input produces results, which sustains the feedback behavior.
Tracking and Celebrating Efficiency Wins
Efficiency improvements that aren’t measured are easily forgotten — and improvements that aren’t recognized rarely compound. Set visible, specific output targets on a monthly basis and post actual results against those targets at the machine.
When an operator’s identification of a seal jaw wear pattern prevents an unplanned stop, calculate and communicate the value of that prevention to the team. When a changeover time is cut from 55 minutes to 22 minutes through a new checklist process, post that result on the production board. These specific, quantified wins build the team’s understanding that efficiency is a skill they own — not something done to their machine by outside consultants.
Staying Current with Industry Best Practices
The cosmetic and pharmaceutical tube packaging industry evolves continuously: new materials, new fill product formulations requiring different machine parameters, new regulatory requirements in key export markets, new automation technologies that change the ROI calculation for equipment investments.
Subscribe to industry publications including Packaging Digest and attend regional trade events (Interpack, Pack Expo, Cosmopack Asia) to stay current with innovations adopted by leading manufacturers. One process improvement or equipment insight from an industry event frequently pays for the cost of attendance many times over. Review the Miyoda Packaging Machinery industry insights blog regularly for technical guides and market trend analysis specific to tube packaging.
10. Measuring Success and Planning for Growth
Establishing Key Performance Indicators (KPIs)
Meaningful KPIs for tube packaging efficiency are specific, measurable, and directly connected to financial outcomes. Avoid abstract metrics (“quality culture improvement”) in favor of numbers you can put on a dashboard and track weekly.
The five KPIs that matter most for tube packaging operation performance:
| KPI | Measurement Method | Target Range |
|---|---|---|
| OEE (Overall Equipment Effectiveness) | Availability × Performance × Quality | ≥80% (world class: 85%) |
| Tubes per shift | Actual counter vs. scheduled production | ≥90% of scheduled volume |
| Unplanned downtime hours/month | Maintenance log | Reduce 15% quarter-over-quarter |
| First-pass yield rate | Inspection rejection count / total produced | ≥97% |
| Changeover time (average) | Timed from last good tube to first good tube | Reduce to <25 min (from typical 45–60 min) |
Calculating Your Efficiency Improvements
Quantify every efficiency improvement in revenue or cost terms — not just operational metrics. This translation from operational data to financial outcomes is what makes efficiency investment legible to business leadership and justifies continued investment.
A worked example for a cosmetic tube line producing 8 million tubes per year:
$$\text{Baseline OEE:}\ 72% \Rightarrow \text{Actual output:}\ 8,000,000\ \text{tubes/year}$$
$$\text{Post-optimization OEE:}\ 86% \Rightarrow \text{Actual output:}\ 8,000,000 \times \frac{86}{72} = 9,556,000\ \text{tubes/year}$$
$$\text{Incremental output:}\ 1,556,000\ \text{tubes} \times $0.09\ \text{margin} = $140,040\ \text{additional annual profit}$$
Against a total optimization investment (maintenance program, training, monitoring system) of $35,000 — payback under 4 months.
Using Data to Plan Your Next Growth Phase
The production data you collect during your optimization program — OEE history, downtime logs, yield rates, changeover times — is the most reliable input for capacity planning and equipment investment decisions.
When your optimized line reaches 90%+ OEE consistently and demand growth projects exceeding your optimized capacity within 18 months, that data set tells you exactly when you need additional capacity and what specification that additional capacity should meet. It also tells you where your current line’s constraints are — which informs whether you need a second complete line, targeted station upgrades, or a shift structure change.
Use the Miyoda Packaging Machinery buyer’s guide for pharmaceutical and cosmetic tube filling machines to benchmark your capacity planning requirements against current machine specifications and market standards before issuing any capital expenditure request.
Watch: How Modern Automatic Tube Filling Lines Maximize Production Output
Understanding what a fully optimized automatic tube filling line looks like in operation helps identify where your current line’s performance gaps are. This video tour shows fill station, seal station, and inline inspection functioning at full production speed on a cosmetic and pharmaceutical tube packaging line:
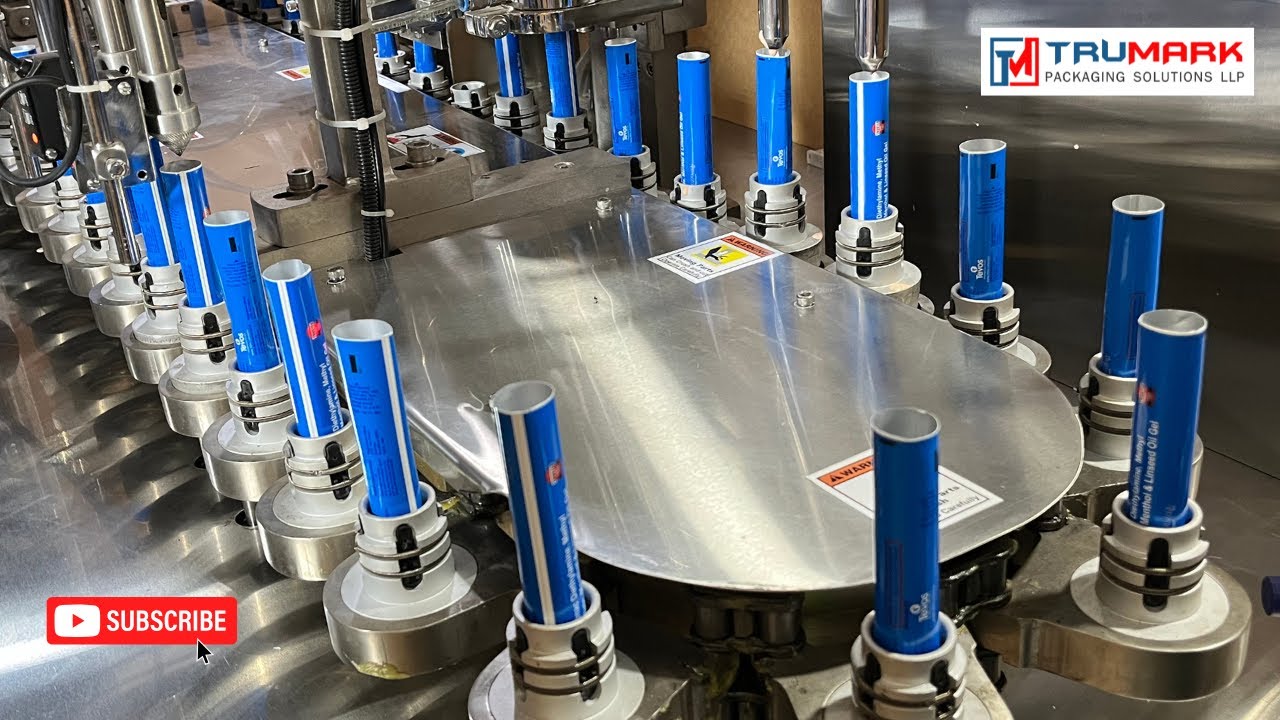
▶ Watch: High-speed automatic tube filling and sealing machine in operation for cosmetic creams, ointments, gels, and pharmaceutical products. Observe fill station performance, ultrasonic seal quality, and inline inspection integration — YouTube
Operator performing systematic quality checks on pharmaceutical tubes during a production run — trained operators who follow documented sampling protocols catch seal integrity issues before they become customer complaints. Photo: Pexels.
Your Roadmap to Maximum Tube Packaging Efficiency
The ten strategies in this guide are a sequenced roadmap, not a list of isolated tips. Start with the baseline audit (Section 1) — you need accurate data before you can set targets or prioritize actions. Move to preventive maintenance (Section 2) — this generates the fastest financial return of any single investment in the guide, with ROI measured in weeks rather than months. Then tackle operator training (Section 4), which multiplies the effectiveness of every other improvement you make.
The efficiency gains compound: a team running a well-maintained machine with documented SOPs and real-time monitoring data will find and fix performance problems faster than the same team operating the same machine without those systems. The 15–30% output improvement that most manufacturers achieve through optimization isn’t a single dramatic change — it’s the cumulative result of a dozen 2–3% improvements working together.
The Competitive Advantage of Efficiency
In a global tube packaging market growing at 3.9% CAGR toward $3.1 billion by 2035, the manufacturers who capture market share aren’t necessarily those with the newest machines. They’re the ones who deliver consistent quality, on-time, at a cost structure that supports competitive pricing and adequate margin. Efficiency is the operational foundation of both.
When a cosmetic brand customer is choosing between two tube packaging suppliers, quality and delivery reliability are the decision criteria — not which supplier has a newer machine. An optimized operation with a 5-year-old machine running at 88% OEE consistently outperforms a complacent operation with a 2-year-old machine running at 72% OEE on every metric the customer cares about.
Build that operational excellence first. The equipment investment decisions that follow will be made from a position of data, clarity, and financial strength — not urgency or guesswork.
Ready to Transform Your Tube Packaging Operation?
If you’re unsure where to start, or want to benchmark your current efficiency against what your line is genuinely capable of, our team is here to help.
Contact Miyoda Packaging Machinery for a free efficiency consultation — tell us your current output, tube format, and machine configuration, and our specialists will identify specific opportunities to boost your throughput, reduce per-tube cost, and strengthen your competitive position.
📞 WhatsApp: +86 13774214471 📧 Email: info@miyodamachine.com 🌐 Website: www.miyodamachine.com
Technical Glossary
| Term | Definition |
|---|---|
| OEE (Overall Equipment Effectiveness) | Composite production performance metric: OEE = Availability × Performance Rate × Quality Rate. World-class benchmark: 85%. |
| SMED (Single-Minute Exchange of Die) | Lean methodology for reducing machine changeover time to under 10 minutes through separation of internal and external tasks. |
| IQ/OQ/PQ | Installation Qualification, Operational Qualification, Performance Qualification — the three-stage equipment validation protocol required for GMP-compliant pharmaceutical production. |
| SOP (Standard Operating Procedure) | Documented, step-by-step instruction for completing a specific process consistently across operators and shifts. |
| Sonotrode | Precision titanium or aluminum component in an ultrasonic sealing system that converts electrical ultrasonic energy into mechanical vibration at the tube seal interface. |
| Viscosity | Resistance of a fill product to flow, measured in centipoise (cP). Higher viscosity products require longer fill cycles and limit achievable line speed. |
| GMP (Good Manufacturing Practice) | Regulatory framework governing manufacturing processes for pharmaceutical and cosmetic products to ensure consistent quality and safety. |
| Seal Peel Strength | The force required to separate a tube seal, measured in N/15 mm. The primary quantitative measure of seal integrity; typically minimum 8–12 N/15 mm for cosmetic and pharmaceutical tubes. |
| Eccentricity | In tube extrusion, the variation in wall thickness around the tube circumference. Low eccentricity indicates uniform material distribution and consistent tube appearance. |
| First-Pass Yield | The percentage of tubes that pass quality inspection without rework or rejection on their first production pass. |
Frequently Asked Questions (FAQs)
1. How much can I realistically increase my tube packaging output without buying new equipment?
Most cosmetic and pharmaceutical tube manufacturers achieve 15–30% output improvement through systematic optimization — maintenance, training, parameter tuning, and changeover reduction — before any capital investment. In operations where maintenance has been deferred and operators are undertrained, gains above 30% are documented. The actual number depends on your starting OEE: if you’re currently at 70%, reaching 85% represents a 21% output increase from the same machine, same shifts, same facility.
2. What is the most common production bottleneck in tube packaging operations?
Changeover time between different tube sizes or formulations consistently tops the list — accounting for 15–25% of lost production time in most cosmetic tube operations. Poorly managed changeovers on a 150-tube/minute line can waste 1,500–2,250 tubes worth of production time per changeover event. Inadequate preventive maintenance is the second most common bottleneck, showing up as unplanned stops that are longer and more disruptive than the equivalent planned maintenance would have been.
3. How often should preventive maintenance be performed on a tube filling machine?
The three-tier schedule works for most operations: daily pre-shift visual checks (10–15 minutes covering seal jaws, fill nozzles, lubrication, and control system alerts), weekly mechanical inspections (1–2 hours covering drive systems, sensors, pneumatics, and fill weight verification), and monthly deep maintenance (4–8 hours covering full drive system, calibration, and machine cleaning). Exact intervals should be adjusted based on your machine’s age, actual usage intensity, and the wear data you collect during inspections.
4. Can I increase line speed without compromising tube seal quality?
Yes — most machines have 10–20% additional speed headroom above their current operational setting before seal quality limits are reached. The key is validated testing: increase speed in 5% increments, run 500 tubes per increment, and measure seal peel strength, fill weight accuracy, and visual rejection rate at each step. Your production speed should be set at 90% of the limit where quality metrics first degrade — giving you the maximum safe operating speed with a buffer against drift.
5. What is the typical ROI timeline for tube packaging efficiency improvements?
Preventive maintenance programs typically show ROI within 4–8 weeks — the first prevented unplanned stop usually covers the cost of one month’s planned maintenance. Operator training investment returns within the first 1–2 months through output improvement and reduced quality rejection. Monitoring system investments typically pay back in 12–18 months through prevented downtime. Complete optimization programs (all strategies combined) typically deliver full ROI in 6–12 months for most operations.
6. How does operator training specifically impact tube packaging production numbers?
Trained operators consistently deliver 20–35% more output than untrained staff on the same machine. The primary mechanism is early problem detection: trained operators recognize developing faults (seal vibration, fill weight drift, indexing irregularity) and intervene in 5–8 minutes; untrained operators wait until the machine stops — typically adding 20–30 minutes of unproductive downtime per event. In operations running two stops per shift that trained operators would catch early, this difference alone equals 1,000–1,800 additional tubes per shift on a 150-tube/minute line.
7. What is the difference between optimizing for cosmetic versus pharmaceutical tube production?
The optimization strategies are identical in structure — maintenance, training, parameters, changeover, monitoring. The differences are in the compliance requirements and the tolerance for speed-quality tradeoffs. Pharmaceutical tube production typically requires validated parameters with documented change control (any parameter adjustment requires documentation), GMP-compliant cleaning between products, and batch records linking machine parameters to each lot. Cosmetic tube production has more operational flexibility. Both benefit equally from the efficiency strategies in this guide — the documentation burden for implementing them is higher in pharmaceutical operations.
8. How do I know if my machine is operating significantly below its potential?
The fastest diagnostic: compare your actual tubes-per-shift output against your machine’s rated capacity at your tube diameter and fill weight. If you’re below 80% of rated capacity, there is substantial optimization potential. If you’re below 70%, a combination of maintenance issues, training gaps, and parameter suboptimization is almost certainly present. Calculating your OEE formally — tracking availability, performance rate, and quality rate separately — will show you exactly which of the three components is responsible for your capacity gap.
9. What monitoring systems should I prioritize for a tube filling and sealing line?
Start with the minimum viable system: a production counter displaying tubes per hour against target, with shift cumulative total visible to both operators and supervisors. This single addition to most lines costs under $2,000 and immediately improves shift-level performance management. As a second step, add fill weight trending and machine fault logging. Full real-time OEE dashboards with temperature and pressure trend monitoring are the third tier — valuable for high-volume operations where the data density justifies the investment.
10. What is the fastest single action to see efficiency improvement on my tube line?
Start with the preventive maintenance checklist — implement the daily pre-shift inspection protocol immediately, without waiting for a full program to be designed. Within the first two weeks, you’ll identify at least one wear item or adjustment need that was trending toward an unplanned stop. The first prevented stop demonstrates the program’s value to your team in concrete financial terms and builds organizational commitment to the full efficiency program. If your changeover times are above 45 minutes, that’s your parallel quick-win: create and laminate a changeover checklist for your most frequent format change this week.
Article produced with research support from Future Market Insights Tube Filling Machine Market Report 2025, OEE benchmarking data from Symestic (2026), and packaging industry maintenance analysis from OxMaint (2025). All financial scenarios are illustrative calculations based on stated assumptions; actual results depend on specific operation parameters.