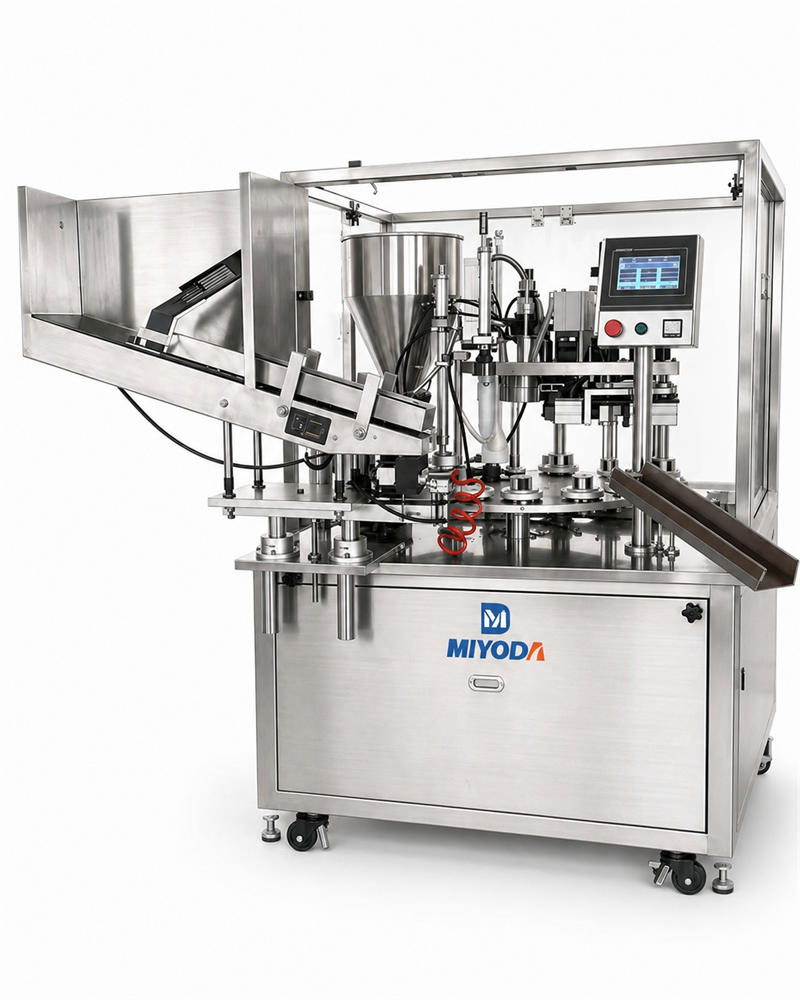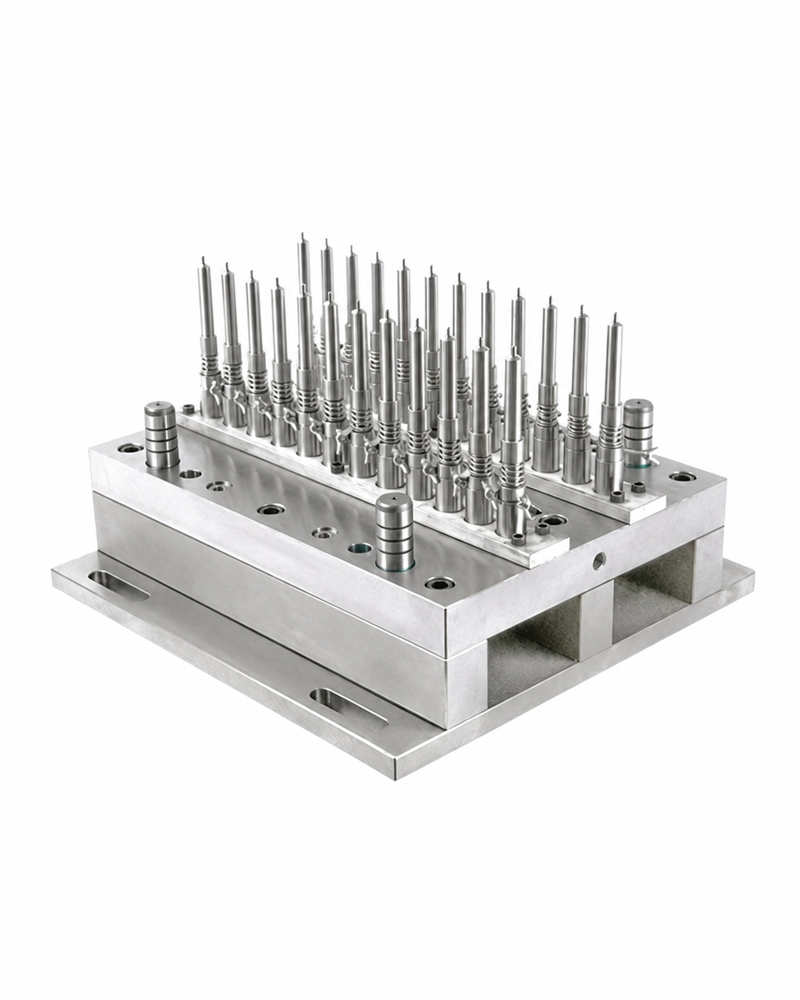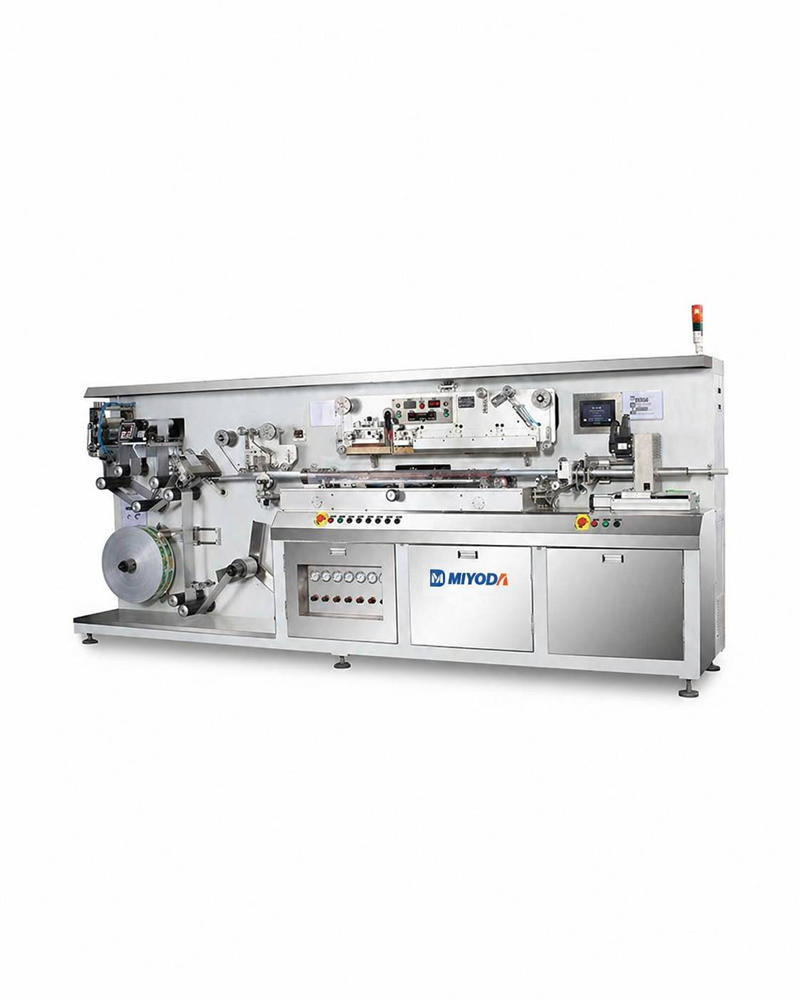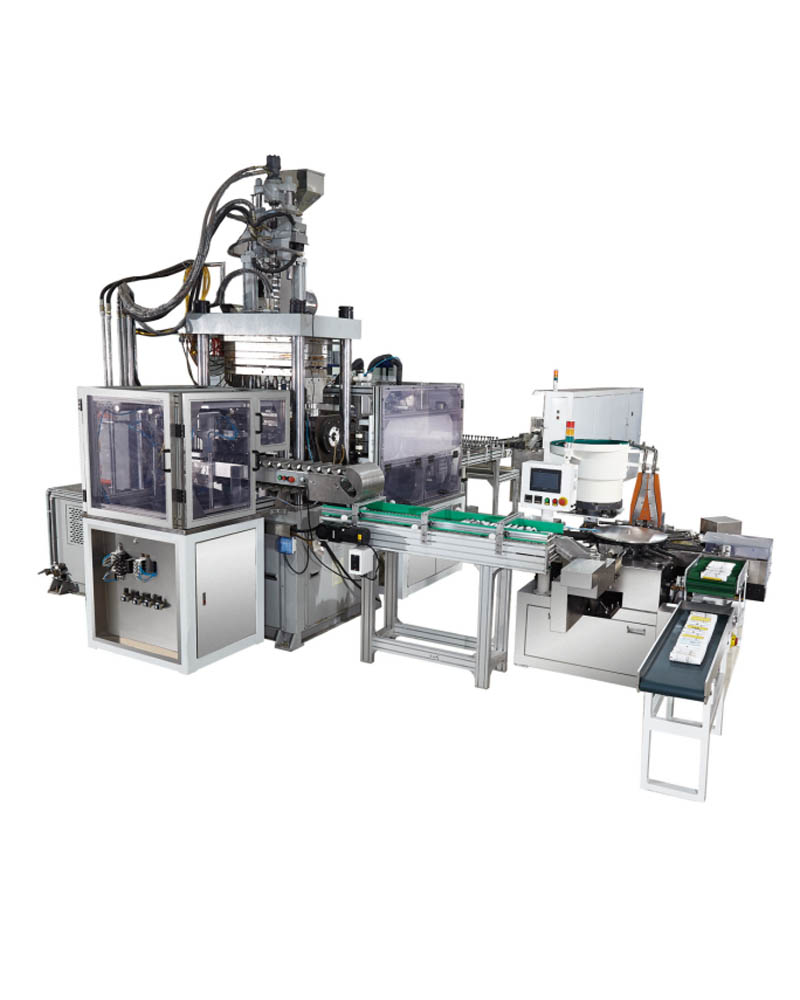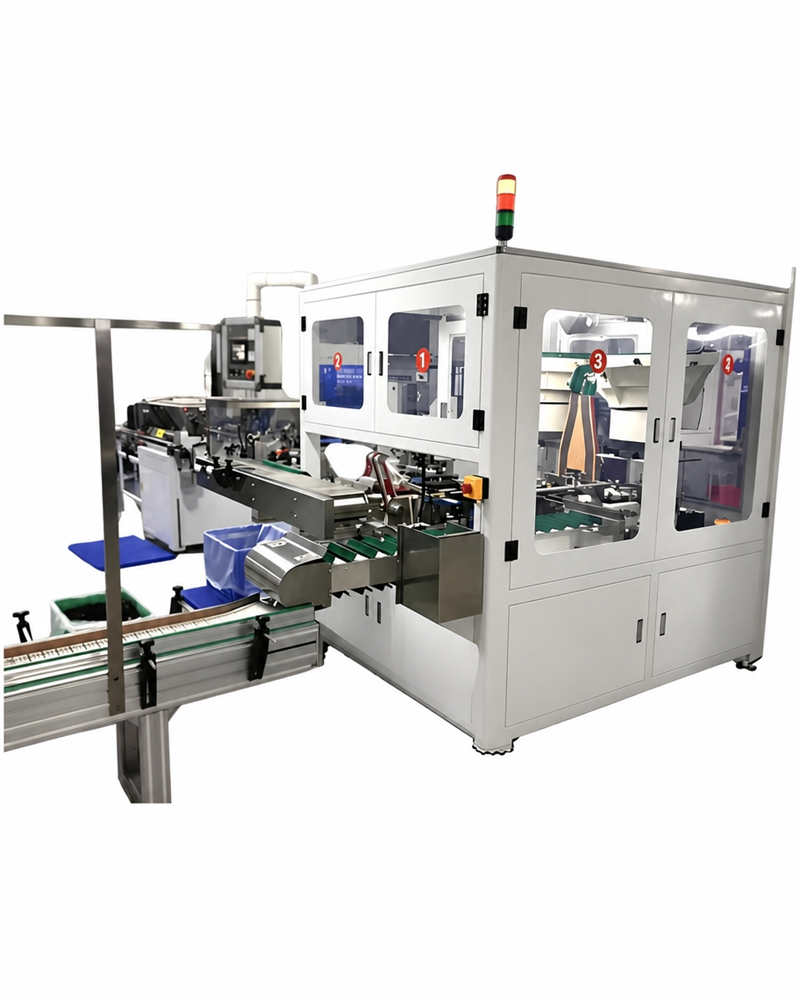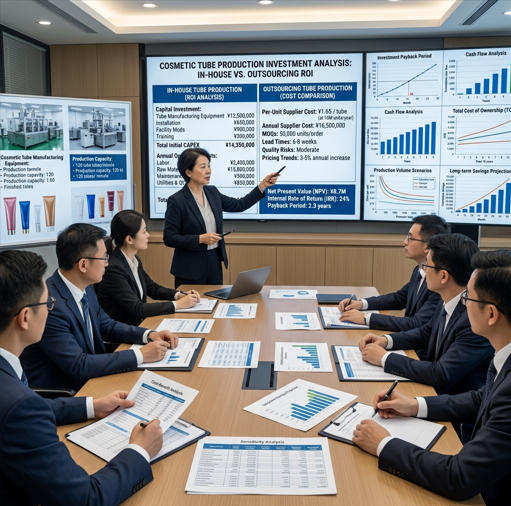
Every month you spend outsourcing your cosmetic or pharmaceutical tube production, you are paying a supplier’s overhead, profit margin, and minimum order premium — on top of your own per-unit cost. Over 36 months at a production volume of 5 million tubes per year, that arrangement can cost between $180,000 and $420,000 more than operating an equivalent in-house tube mill system.
This guide gives you the real numbers: total cost of ownership, payback period benchmarks by production volume, a customizable ROI model, machine-by-machine cost comparisons, and real case studies from manufacturers who made the switch and documented the results.
Whether you are evaluating your first tube mill purchase, advising a client on equipment investment, or building the financial model to secure budget approval — this is the analysis you need before your next decision.

1. Understanding Total Cost of Ownership (TCO) for Tube Mill Equipment
What Is Total Cost of Ownership?
Total Cost of Ownership (TCO) — the complete financial cost of acquiring, operating, and maintaining an asset over its useful life — is the only defensible basis for a tube mill investment decision. A machine with a $120,000 purchase price and $18,000 annual operating cost is not cheaper over five years than a $180,000 machine with $8,000 annual operating cost. TCO makes that arithmetic visible before you sign a purchase order.
Breaking Down the TCO Formula
The TCO formula for tube mill equipment captures every dollar that ownership will require:
$$\text{TCO} = C_{purchase} + C_{install} + C_{training} + \sum_{y=1}^{n}(C_{labor} + C_{materials} + C_{maintenance} + C_{utilities} + C_{quality}) – S_{residual}$$Where n = ownership years, and Sresidual = equipment resale or salvage value at end of life.
Why TCO Matters More Than Purchase Price Alone
A pharmaceutical packaging manufacturer in Southeast Asia reported spending $62,000 on a low-purchase-price tube line — only to discover that the machine’s 14% higher energy consumption, $9,000/year spare parts requirement, and 73% uptime (vs. industry standard 92%+) resulted in a 5-year TCO 38% higher than a comparable machine priced $41,000 higher at purchase. Purchase price optimization without TCO discipline is one of the most expensive mistakes tube producers make.
Key Cost Components You Need to Calculate
Capital Equipment Costs
Capital costs include the machine purchase price, tooling and dies for your tube diameter range, shipping and freight (typically 3–8% of equipment value for international shipments), customs and import duties, and any ancillary equipment required (cooling water chillers, compressed air systems, material handling conveyors). A complete, production-ready tube extrusion line typically costs 15–25% more than the base machine price once all ancillary systems are included — a number that should be in your financial model from day one, not discovered during installation.
Installation, Setup, and Training Expenses
Installation and commissioning costs for a mid-range cosmetic tube extrusion line typically run $8,000–$25,000, covering engineer travel, site preparation work, line commissioning, and first-production qualification runs. Operator training — either on-site at your facility or at the manufacturer’s factory — adds $3,000–$10,000 for a comprehensive program covering machine operation, process parameter setting, troubleshooting, and basic maintenance. Manufacturers who skip structured training consistently report higher defect rates and longer time-to-productivity in the first 90 days of operation.
Hidden Costs Most Manufacturers Overlook
Maintenance and Preventive Service Requirements
Preventive maintenance on a tube extrusion line — including consumable parts (seals, bearings, heating elements, screw and barrel inspection) — costs approximately 2–4% of equipment purchase price annually. Reactive maintenance (unplanned breakdowns) costs 3–6× more per hour of downtime than equivalent planned maintenance, primarily due to emergency parts sourcing, technician overtime, and production loss. A $200,000 machine with no preventive maintenance program can generate $30,000+ in annual reactive maintenance costs — a figure that rarely appears in initial investment proposals.
Raw Material Handling and Storage
In-house tube production requires on-site storage for plastic pellets, laminate rolls, aluminum foil stock, and closure components. Depending on your production volume and supplier lead times, you may need to carry 30–60 days of raw material inventory. At a production scale of 3 million tubes per year, that inventory level represents $35,000–$80,000 in working capital tied up in raw materials — a real cost of ownership that finance teams must include in investment analysis but procurement teams frequently omit.
📋 5-Year TCO Breakdown: Mid-Range Cosmetic Tube Extrusion Line
| Cost Category | Year 1 | Year 2 | Year 3 | Year 4 | Year 5 | 5-Yr Total |
|---|---|---|---|---|---|---|
| Capital Equipment + Install | $220,000 | — | — | — | — | $220,000 |
| Labor (1–2 operators) | $52,000 | $52,000 | $54,000 | $54,000 | $56,000 | $268,000 |
| Raw Materials (resin, etc.) | $85,000 | $88,000 | $91,000 | $94,000 | $97,000 | $455,000 |
| Maintenance & Parts | $6,000 | $7,000 | $8,000 | $9,000 | $10,000 | $40,000 |
| Utilities (electricity, water) | $14,000 | $14,000 | $14,500 | $15,000 | $15,000 | $72,500 |
| Quality Control & Compliance | $12,000 | $8,000 | $8,000 | $8,500 | $8,500 | $45,000 |
| Total Annual TCO | $389,000 | $169,000 | $175,500 | $180,500 | $186,500 | $1,100,500 |
Based on a ~$180,000 machine producing 4–5 million tubes/year. Raw material costs reflect direct production inputs only; selling price and revenue not included.
2. Initial Investment vs. Long-Term Savings: The Real Numbers

Upfront Capital Requirements for Tube Mill Systems
Equipment Purchase Costs by Machine Type and Capacity
Tube mill equipment spans a wide price range, reflecting meaningful differences in automation level, production speed, tube diameter range, and material compatibility. The figures below reflect current market pricing for cosmetic and pharmaceutical soft tube production systems in 2025:
| Machine Category | Price Range (USD) | Output (tubes/min) | Ideal Annual Volume | Automation Level |
|---|---|---|---|---|
| Entry-Level Semi-Auto | $30,000 – $80,000 | 10 – 25 | 1M – 5M | Semi-automatic |
| Mid-Range Automated | $100,000 – $250,000 | 30 – 80 | 5M – 20M | Fully automatic |
| High-Speed Production | $280,000 – $600,000+ | 80 – 300+ | 20M – 100M+ | Fully auto + Industry 4.0 |
Infrastructure and Facility Modifications Needed
Facility preparation costs vary significantly based on your current infrastructure. A facility with adequate three-phase power, compressed air infrastructure, and concrete flooring rated for equipment loads may need only $5,000–$15,000 in preparation. A facility requiring electrical upgrades, HVAC modifications for temperature-controlled production, and flooring reinforcement can spend $40,000–$90,000 before the machine arrives — a figure that should be scoped and quoted before the equipment purchase is finalized, not after.
Year-One Operating Costs Breakdown
Labor, Utilities, and Consumables
Year one carries higher costs than subsequent years due to the learning curve effect and higher consumable usage during process optimization. A typical mid-range cosmetic tube line in a single-shift operation requires 1–2 operators at $26,000–$32,000 each annually (varying significantly by geography). Utilities typically run $12,000–$18,000 per year for electricity and cooling water. Consumables — dies, cutting blades, sealing elements, lubricants — add $6,000–$10,000 in year one, declining to $4,000–$7,000 after the first year as process optimization reduces waste.
Quality Control and Compliance Investments
Initial quality control setup — vision inspection systems, dimensional gauges, seal strength testers, and material testing equipment — represents a one-time investment of $8,000–$20,000 for a production line serving pharmaceutical clients. For cosmetic-only production with less stringent documentation requirements, this can be as low as $3,000–$8,000. Ongoing quality system costs (calibration, consumable test materials, periodic external lab testing) run $6,000–$12,000 annually and are non-negotiable for any supplier qualifying to pharmaceutical brand owner standards.
Cost Reduction Timeline: When You Break Even
Typical Payback Periods by Production Volume
Payback period — the point at which cumulative savings from in-house production equal the total investment — is the most practically useful investment metric for tube mill decisions. The data below reflects real-world payback outcomes across different production scales, based on manufacturers transitioning from outsourcing at market-typical outsourcing rates:
📊 Typical Payback Period by Annual Production Volume
Payback periods shorten dramatically as production volume increases. Manufacturers producing above 15M units/year should expect breakeven within 20 months of installation.
How Production Scale Affects Your ROI Timeline
Scale affects ROI through two simultaneous mechanisms: fixed cost absorption (your capital investment and fixed operating costs are spread across more units, reducing cost-per-unit) and negotiating power (larger raw material purchases unlock better pricing, typically 8–15% below spot market for LDPE and laminate materials at volumes above 50 metric tons per year). A manufacturer growing from 3 million to 8 million tubes per year on the same equipment doesn’t just produce more — they produce more profitably per unit.
3. Outsourcing vs. In-House Production: A Cost Comparison
The True Cost of Outsourcing Tube Fabrication
Per-Unit Pricing and Minimum Order Requirements
Contract tube manufacturers typically price cosmetic soft tubes at $0.08–$0.35 per unit depending on tube complexity, material structure, print requirements, and order volume. This per-unit price contains the supplier’s material cost, labor, overhead, and profit margin — typically 25–40% above actual production cost. At a production scale of 5 million tubes per year at $0.12 per unit, you are spending $600,000 annually with your outsource supplier. The equivalent in-house production cost — materials, labor, utilities, maintenance — typically runs $0.06–$0.08 per unit on a mid-range automated line, representing annual savings of $200,000–$300,000 against the outsourcing scenario.
Minimum order requirements (MOQs) add a second financial penalty to outsourcing: most contract tube manufacturers require MOQs of 10,000–50,000 units per SKU per order. For brands with multiple SKU variants, limited editions, or seasonal packaging changes, these MOQs force over-ordering that creates inventory carrying costs and obsolescence risk — a financial burden that disappears entirely with in-house production flexibility.
Lead Times, Rush Fees, and Supply Chain Risks
Standard lead times from contract tube suppliers run 6–12 weeks for new orders and 4–8 weeks for repeat runs. Rush orders — requiring faster delivery — typically carry 15–30% premium pricing. During peak demand periods (pre-holiday season in cosmetics, flu season in OTC pharmaceuticals), suppliers prioritize their largest volume clients, leaving smaller brands facing extended lead times that can delay product launches and miss retail windows. Three supply chain disruptions during a 12-month period — each requiring rush production or resulting in a missed retailer delivery window — can cost a cosmetic brand $80,000–$200,000 in lost revenue and emergency logistics costs.
Hidden Outsourcing Expenses
Quality Control Issues and Rework Costs
When outsourced tubes arrive with quality defects — color inconsistency, seal failures, print misregistration — the brand owner bears the cost of incoming inspection, rework or rejection, supplier claims processing, and production schedule disruption. Industry surveys of cosmetic brands using contract tube suppliers report that 3–7% of incoming orders require partial or full rework or replacement. At 5 million tubes per year with a 4% defect rate and $0.12/tube value, that is 200,000 tubes per year — $24,000 in direct tube value, plus the downstream cost of filling, labeling, and logistics disruption that compounds the loss several times over.
Logistics, Shipping, and Inventory Management Overhead
International sourcing of tubes adds freight costs (typically $0.008–$0.020 per tube for sea freight, $0.04–$0.10 per tube for air freight), import duties (5–12% of tube value depending on country and material classification), and customs brokerage fees. Inventory management for outsourced tubes — warehousing, cycle counting, lot tracking for pharmaceutical compliance — adds 15–25% of tube value annually in carrying costs. These costs are systematic, recurring, and entirely eliminated by in-house production.
In-House Production Advantages Beyond Cost Savings
Control Over Quality and Specifications
In-house production gives you direct access to process parameters — extrusion temperatures, die geometry, cooling profile, seal strength settings — that determine tube quality. When a formulation change requires a different tube wall thickness or barrier specification, you can execute the change in hours rather than waiting 6 weeks for a new outsourced batch. One pharmaceutical brand reported that when their active ingredient concentration change required a 15% increase in tube barrier specification, the in-house production team completed the process re-qualification and produced a new validated batch in 11 days — a change that would have taken a minimum of 10 weeks through their previous contract supplier.
Faster Time-to-Market and Reduced Lead Times
In a market where cosmetic brands launch 3–6 new products per quarter and retailers penalize missed delivery windows with charge-backs averaging 2–5% of invoice value, the ability to produce tubes on 1–3 week internal lead times (vs. 6–12 weeks outsourced) is a measurable competitive advantage. Brands with in-house tube production consistently achieve faster market response to trend opportunities — a capability that is difficult to quantify in a single ROI model but generates compounding commercial value over time.
⚖️ 5-Year Cost Comparison: Outsourcing vs. In-House at 5M Tubes/Year
| Cost Item | Outsourcing (5 Yrs) | In-House (5 Yrs) | Savings (In-House) |
|---|---|---|---|
| Base per-unit tube cost | $600,000/yr × 5 = $3,000,000 | ~$350,000/yr × 5 = $1,750,000 | $1,250,000 |
| Quality defect & rework costs | $24,000/yr = $120,000 | $6,000/yr = $30,000 | $90,000 |
| Logistics & freight | $50,000/yr = $250,000 | $0 | $250,000 |
| Rush fees & MOQ overstock | $30,000/yr = $150,000 | $0 | $150,000 |
| Equipment investment (in-house only) | $0 | $220,000 (one-time) | -$220,000 |
| 5-Year Total Cost | $3,520,000 | $2,000,000 | $1,520,000 saved |
4. Interactive ROI Calculator: Customize Your Projections
▶ Watch: When to Buy Equipment — How to Calculate ROI and Structure Your Investment Decision
How to Use Our ROI Calculator Tool
Entering Your Production Volume and Specifications
Start by entering your current annual tube consumption (in units), your current outsourcing cost per unit (check your last 12 months of invoices and divide total spend by total units received — include freight and any quality-related costs in the numerator), and your target production volume over the next 3 years. These three inputs drive 70% of the ROI calculation’s variance; small errors in estimating current outsourcing cost per unit can shift your projected payback period by 4–8 months.
Adjusting Variables for Accurate Projections
Secondary variables — labor cost per hour in your geography, local electricity cost per kWh, estimated raw material pricing, and planned equipment utilization rate — refine the calculation. Most manufacturers entering this data for the first time discover that their actual outsourcing cost is 12–18% higher than they believed, because they were only counting the supplier invoice and not the logistics, inspection, rework, and carrying costs that accumulate in other budget lines.
🔢 Simplified ROI Estimator — Tube Mill Investment
📦 Your Annual Tube Volume
Enter: X million units/year
e.g., 5,000,000 tubes/year
💲 Current Outsourcing Cost/Unit
Enter: $0.XX per tube
e.g., $0.12 per tube (incl. freight)
⚙️ Machine Investment (all-in)
Enter: $XXX,XXX
e.g., $220,000 (machine + install + training)
🏭 In-House Cost/Unit (estimated)
Enter: $0.0X per tube
e.g., $0.07 per tube (materials + labor + utilities)
📐 Payback Period Formula:
$$\text{Payback Period (months)} = \frac{\text{Total Investment}}{\left(\text{Outsource Cost/Unit} – \text{In-House Cost/Unit}\right) \times \text{Monthly Volume}}$$Example: $220,000 ÷ [($0.12 − $0.07) × 416,667 units/mo] = $220,000 ÷ $20,833 = ~10.6 months at 5M units/year
💡 For a personalized ROI analysis with your exact production parameters and machine recommendations, contact Miyoda Packaging Machinery’s specialists — they provide free custom investment models for qualified manufacturers.
Understanding Calculator Results
Payback Period Interpretation
A payback period under 24 months is generally considered excellent for manufacturing equipment investments and will satisfy most corporate finance approval processes. Between 24 and 36 months is acceptable with strategic justification (quality control benefits, lead time advantages). Beyond 36 months requires either a strong strategic rationale or adjustment of the production volume or machine selection. If your calculation shows a payback period above 48 months at your current production volume, you may be a stronger candidate for a semi-automatic entry-level system, a shared production arrangement, or a production growth plan before full capital investment.
5-Year and 10-Year Profitability Projections
Post-payback, the investment generates pure savings. A tube mill with a 24-month payback on a $220,000 investment and $110,000/year net savings generates $660,000 in cumulative net savings by year 5 and $1,540,000 by year 10 — a 10-year return of 7× the initial investment. This is the number that should appear on the first page of your capital approval request, alongside the payback period.
Scenario Planning with the Calculator
Comparing Different Machine Models and Capacities
Scenario planning reveals a counterintuitive result that surprises many first-time equipment buyers: a machine that costs $80,000 more but produces 40% more units per hour and operates at 94% uptime vs. 81% uptime can have a shorter payback period than the cheaper alternative — because the denominator of your payback calculation (annual savings) grows faster than the numerator (investment cost). Running at least three machine scenarios — entry, mid, high — before finalizing equipment selection is standard practice for experienced capital buyers.
Testing Growth Scenarios and Expansion Plans
If your business plan projects 25% annual volume growth, model your ROI with year 1, year 3, and year 5 production volumes separately — and compare a machine sized for today’s volume against one with 50% spare capacity. The latter typically costs 20–35% more but avoids the disruption and cost of a second equipment investment cycle within a 5-year window. Overcapacity at purchase is a feature, not a waste, when your business model has credible growth evidence behind it.
5. Detailed Cost Breakdown by Machine Type and Capacity

Entry-Level Tube Mill Systems
Ideal Use Cases and Production Ranges
Entry-level semi-automatic systems in the $30,000–$80,000 range are best suited for brands producing 1–5 million tubes per year, those testing in-house production before committing to full automation, and manufacturers with high SKU diversity requiring frequent product changeovers. These systems typically require 2 operators per shift, produce 10–25 tubes per minute, and can be retooled for different tube diameters in 45–90 minutes. A cosmetic brand shifting from a 100% outsourced model to entry-level in-house production typically breaks even within 30–48 months, depending on their previous outsourcing rate.
Cost Structure and Expected ROI Timeline
The ROI risk at entry level is primarily operational: a semi-automatic system’s per-unit savings versus outsourcing are smaller, and its performance is more operator-dependent. A team that runs the machine well achieves the financial projections; a team that struggles with setup and changeovers underperforms. For this reason, investing in comprehensive initial operator training — even if it costs an additional $5,000–$8,000 — generates a return measured in percentage points of uptime and percentage reductions in material waste that typically exceeds 10× the training cost within the first year of operation.
Mid-Range Automated Tube Mills
Efficiency Gains and Labor Cost Reduction
Mid-range fully automatic systems ($100,000–$250,000) represent the sweet spot for most cosmetic and pharmaceutical tube producers in the 5–20 million unit per year range. A fully automatic line at this tier typically requires only 1 operator per shift — compared to 2–3 for equivalent semi-automatic output. This labor reduction alone accounts for $26,000–$52,000 in annual savings, contributing 20–30% of the total investment payback. Miyoda Packaging Machinery’s tube extrusion systems in this category are designed specifically for cosmetic and pharmaceutical applications, with multi-layer capability and integrated temperature control that mid-range producers need without the complexity overhead of enterprise-grade platforms.
Payback Period and Long-Term Profitability
At 10 million tubes per year on a $180,000 mid-range system with $0.05 per unit net savings versus outsourcing, the payback calculation produces: $180,000 ÷ ($0.05 × 10,000,000/12 per month) = 4.3 months payback. More realistic estimates accounting for ramp-up time and facility preparation land in the 18–28 month range at this production volume — consistently within the “excellent investment” category for manufacturing capital approval.
High-Speed Production Systems
Premium Investment for Maximum Output
High-speed systems producing 80–300 tubes per minute ($280,000–$600,000+) are designed for manufacturers with stable, high-volume demand — contract tube manufacturers, large cosmetic groups, or pharmaceutical OEMs producing multiple brands from a single facility. These systems integrate Industry 4.0 data capture, vision-based quality inspection, predictive maintenance connectivity, and often multi-machine networked control. Their unit economics are exceptional: at 300 tubes per minute and 85% uptime over 2 shifts, a single line produces approximately 73 million tubes per year — delivering per-unit production costs below $0.04 in favorable labor and energy cost environments.
ROI for High-Volume Cosmetic and Pharmaceutical Manufacturers
High-volume producers who previously outsourced at $0.10–$0.15 per tube and switch to in-house high-speed production at $0.035–$0.055 per unit generate annual savings of $4–$8 million at 80 million units per year — achieving payback on a $500,000 investment in as little as 9–18 months. The financial case at this scale is not a question; the question becomes which system to choose and which supplier can support production at pharmaceutical compliance standards.
6. Operating Costs: What You’ll Actually Spend Annually
Labor Costs and Staffing Requirements
Operator Training and Skill Development Investment
Tube extrusion operators do not need engineering degrees — they need mechanical aptitude, attention to process parameters, and disciplined adherence to SOPs. Initial training to production-competent level takes 1–2 weeks with a qualified machine manufacturer trainer. Most reputable equipment suppliers include 5–10 days of on-site training in the equipment package or charge $1,500–$3,000 per day for additional training. Annual refresher training and cross-training of backup operators costs $2,000–$5,000 — a modest ongoing investment that prevents the operational risk of a single-operator dependency.
How Automation Reduces Long-Term Labor Expenses
The progression from manual to fully automated tube production follows a documented labor efficiency curve: manual (3–4 operators per line, 15–20 tubes/min) → semi-automatic (2 operators, 25–40 tubes/min) → fully automatic (1 operator, 50–100 tubes/min) → automated with vision inspection (1 operator managing 2 lines, 100+ tubes/min per line). The labor cost per 1,000 tubes produced drops from approximately $8–$12 (manual) to $1.50–$3.00 (fully automated) — a 70–80% reduction that compounds over millions of units and directly improves gross margin on every tube shipped.
Raw Material and Consumable Expenses
Aluminum, Plastic, and Laminate Pricing
Raw material costs represent 40–60% of in-house production costs for cosmetic tubes, making material procurement strategy as important as equipment selection. LDPE and HDPE resin pricing fluctuates with oil markets — 2024–2025 pricing has ranged from $0.85–$1.30/kg for commodity LDPE grades. ABL laminate roll stock for tube production runs $2.50–$4.50/kg depending on aluminum content and surface treatment. At a production scale of 5 million tubes per year with an average tube weight of 8g per tube, raw material cost totals 40,000 kg per year — at $1.10/kg LDPE average, that is $44,000 in resin annually, before allowing for scrap and processing losses.
Waste Reduction and Material Efficiency Improvements
Modern tube extrusion systems achieve material utilization rates of 94–97% — meaning only 3–6% of input resin becomes scrap. Older or poorly optimized systems can waste 8–12% of material input. The financial difference is meaningful: at a production volume consuming 40,000 kg of resin per year at $1.10/kg, closing a 5-percentage-point material efficiency gap saves $2,200 annually per production line — and on multi-layer systems using expensive EVOH barrier resin at $3.50–$5.00/kg, the savings per efficiency point are proportionally higher.
Maintenance, Repairs, and Parts Replacement
Preventive Maintenance Schedules and Costs
A properly followed preventive maintenance schedule for a mid-range cosmetic tube extrusion line covers: daily cleaning and visual inspection (30 minutes), weekly dimensional checks and lubrication (1 hour), monthly calibration verification and seal element inspection (2 hours), and annual deep service including screw/barrel measurement, drive alignment, and heating element testing (1–2 days with manufacturer service engineer). Total preventive maintenance cost including parts and labor: $6,000–$12,000 per year, or 3–5% of equipment purchase price — consistent with industry benchmarks for polymer processing equipment.
Warranty Coverage and Extended Service Plans
Standard equipment warranties on tube extrusion systems run 12–24 months for parts and 12 months for labor. Extended service plans — covering 3–5 years of parts at guaranteed pricing, annual service engineer visits, and priority technical support — cost $8,000–$20,000 for a mid-range line and provide meaningful financial protection against the unpredictable tail risk of major component failures (extruder gearbox: $15,000–$35,000 replacement; heater barrel: $8,000–$18,000). For pharmaceutical producers where downtime has regulatory implications (batch documentation continuity, stability sample chain of custody), extended coverage is a risk management purchase, not just a maintenance cost.
Utilities and Facility Costs
Energy Consumption and Efficiency Ratings
A mid-range cosmetic tube extrusion line draws 15–35 kW of installed power during normal operation. At an industrial electricity rate of $0.08–$0.12/kWh and 4,000–5,000 annual production hours, annual electricity cost runs $4,800–$21,000 depending on system size and local energy tariffs. Energy-efficient motor drives (variable frequency drives on extruder and haul-off motors) reduce consumption by 15–25% compared to fixed-speed legacy systems and typically pay back their cost premium within 18–30 months through electricity savings alone.
Space Requirements and Infrastructure Needs
A complete mid-range tube extrusion line — extruder, die, cooling tank, haul-off, cutter, and collection system — requires approximately 500–800 square feet of production floor space, plus additional area for raw material staging (200–400 sq ft), finished goods buffer (300–500 sq ft), and quality control workstation (100–200 sq ft). Total facility footprint for a single-line operation: 1,100–1,900 square feet. For manufacturers evaluating whether current facilities can accommodate in-house production, this footprint analysis is usually the first filter — and most medium-sized cosmetic or pharmaceutical facilities can accommodate it within existing floor space with minor layout adjustments.
7. Revenue Impact: How In-House Production Increases Profitability
Margin Improvement Through Cost Control
Reducing Per-Unit Production Costs
Moving from $0.12/tube outsourced to $0.07/tube in-house on a product retailing at $12.00 in a tube containing 50ml of product sounds like a small number in isolation. But this $0.05 improvement in packaging cost represents a 42% reduction in packaging COGS — which, at a 35% gross margin baseline, translates directly to a 1.6 percentage point improvement in product gross margin. Across a product portfolio generating $10 million in annual revenue, that margin improvement generates $160,000 in incremental gross profit annually — without changing pricing, formulation, or sales strategy.
Pricing Strategy Opportunities with Lower Manufacturing Costs
Lower production costs create strategic options that outsourced manufacturers lack: the ability to absorb pricing pressure from retail customers without eroding margin, the ability to invest savings in premium materials (upgraded barrier structure, more sophisticated printing) while maintaining price parity with competitors, or the ability to price aggressively in new markets while maintaining profitability thresholds. Each of these options has commercial value that doesn’t appear in a direct cost comparison but compounds over time in market share and brand positioning outcomes.
Revenue Growth from Faster Production and Delivery
Capturing Market Share with Competitive Lead Times
A personal care brand that cut its new product introduction lead time from 14 weeks (outsourced tubes + filling + labeling) to 5 weeks (in-house tube production + filling + labeling) increased its annual new product launch cadence from 8 to 21 SKUs per year. This directly correlated with a 28% revenue increase over 24 months — not from price increases, but from more products in market, more shelf facings, and faster response to trend-driven opportunities that competitors with outsourced supply chains consistently missed. The in-house tube production capability was the enabling factor, though it appeared nowhere on the product P&L.
Premium Positioning Through Quality Control
In-house production enables quality standards that outsourced production cannot reliably deliver: 100% inline dimensional inspection, same-day response to print color drift, real-time barrier performance verification through process data rather than periodic lab sampling. These capabilities translate into commercial value at the retailer and brand owner level: fewer defect claims, more consistent shelf presentation, and the ability to offer customized tube specifications — unique diameter, barrier level, or finish — that generic outsource suppliers cannot economically provide.
Secondary Revenue Streams
Contract Manufacturing for Other Brands
A tube production facility operating at 60–70% of capacity has 30–40% of machine time available for contract manufacturing — producing tubes for other brands at margin. The global personal care contract manufacturing market was valued at $24.18 billion in 2025 and is growing at 8.2% CAGR. Entering this market with a qualified tube production facility can generate $150,000–$600,000 in incremental annual revenue for a mid-range facility — effectively turning excess capacity into a second profit center that further accelerates the original machine investment payback.
Custom Tube Solutions as a Competitive Advantage
Brands with in-house tube capability can offer co-development services to smaller brands — helping them design and produce custom tube structures that no generic outsource supplier stocks. This positions the facility as a value-added packaging partner rather than a commodity supplier, commanding 15–35% premium pricing on custom tube contracts versus standard catalogue tube pricing. For equipment distributors advising their clients, this revenue diversification argument is frequently the tipping point that converts a hesitant buyer into a committed investor.
📊 Annual Profitability Improvement Sources — In-House vs. Outsourced (5M tubes/yr)
Estimated distribution of total annual value created by switching to in-house production
8. Risk Mitigation and Financial Protection
Depreciation and Asset Management
Equipment Lifespan and Replacement Cycles
Quality cosmetic and pharmaceutical tube extrusion equipment maintains productive service for 10–15 years with proper preventive maintenance. Straight-line depreciation over a 10-year schedule on a $200,000 investment produces a $20,000 annual depreciation charge — a non-cash expense that reduces taxable income by $20,000/year, generating $5,000–$7,000 in annual tax benefit at typical corporate tax rates. This depreciation shield contributes meaningfully to the true after-tax ROI of the investment and should be included in the financial model presented to ownership or finance committees.
Tax Deductions and Capital Equipment Incentives
US-based manufacturers benefit from Section 179 expensing, which allows immediate deduction of up to $2,500,000 in qualifying equipment purchases in the tax year of acquisition (2025 limit). A $220,000 tube line investment expensed under Section 179 at a 25% effective corporate tax rate generates $55,000 in first-year tax savings — effectively reducing the net investment to $165,000 and shortening the payback period by several months. Bonus depreciation (currently phasing down from 100% to 40% by 2025 under current law) offers an additional accelerated write-off path for manufacturers who can use it. Consult your tax advisor for country-specific equivalents outside the US — most OECD nations offer comparable capital equipment incentive programs.
Financing Options and Payment Plans
Equipment Leasing vs. Purchase Analysis
Equipment leasing allows manufacturers to acquire tube production capability with zero or minimal upfront capital, preserving working capital for raw materials, staffing, and operational ramp-up. Packaging equipment financing options including operating leases (off-balance-sheet, lower monthly payments, return option at end), finance leases (builds equity, lower total cost, on balance sheet), and sale-leaseback arrangements (release capital from existing owned equipment) each have distinct accounting and tax implications. The general decision framework: if your business generates consistent positive cash flow and has high confidence in long-term production volume, purchase is financially superior over 5+ years. If capital preservation, flexibility, or balance sheet optimization is the priority, leasing at 6–12% annual rate is a credible alternative.
Loan Options and Manufacturer Financing Programs
Many tube machinery manufacturers — including Miyoda Packaging Machinery — can facilitate equipment financing connections, deferred payment arrangements, or staged payment schedules that align cash outflow with production ramp-up and revenue generation. SBA 504 loans (for US-based manufacturers) offer 10-year terms at 4–6% effective rates for equipment purchases with as little as 10% down — among the most cost-effective financing available for manufacturing capital. Manufacturer-facilitated payment plans that link to production milestones are increasingly common for qualified buyers, reducing the front-loaded financial risk of equipment investment.
Protection Against Market Volatility
Reducing Supply Chain Dependency
The 2020–2022 global supply chain disruption exposed a systemic vulnerability in cosmetic and pharmaceutical brands that depended on outsourced tube supply from a small number of contract manufacturers: when those suppliers faced their own capacity, raw material, or logistics constraints, their clients had no alternative. Brands with in-house tube production experienced none of these disruption events — they controlled their supply chain at the packaging level, which is frequently the longest-lead-time and most constraining element of a finished product’s bill of materials. The insurance value of supply chain independence — difficult to quantify in a spreadsheet model but viscerally understood by anyone who managed a product launch during a supply disruption — is real and permanent.
Insulating Your Business from Outsourcing Price Increases
Contract tube supplier pricing has increased an average of 8–15% in each of the past three years, driven by resin cost inflation, labor cost increases, and logistics cost escalation. In-house producers are insulated from supplier pricing decisions — they buy raw materials directly at market prices, which tend to be more transparent and competitively priced than finished tube pricing from intermediary suppliers. A brand that locked in outsourced tube pricing in 2021 and renegotiated in 2024 typically saw cost increases of 22–35% over that period; an equivalent in-house production operation saw total cost increases of only 8–12% over the same period, primarily from raw material inflation.
9. Real-World Case Studies: Investment Success Stories

Small Cosmetic Brand: From Outsourcing to In-House Production
💄 Initial Investment and Setup Timeline
A mid-sized cosmetic brand producing 3.5 million tubes per year — primarily natural skincare products with sensitive active ingredients — had been outsourcing tube production at $0.14/unit (including logistics). Their supplier relationship had produced three consecutive years of 10%+ price increases and one significant supply disruption that delayed a retail product launch by 9 weeks, resulting in a $140,000 charge-back from their primary retailer.
Following evaluation of three machine options, they selected a fully automatic 5-layer co-extrusion line with integrated vision inspection. Total investment including installation, tooling, quality testing equipment, and first-year spare parts kit: $267,000. Facility preparation (electrical upgrade, floor reinforcement, cooling water circuit): $18,000. Commissioning and operator training: $12,000. Total first-year commitment: $297,000.
✅ Results: Cost Savings and Growth Metrics
In-house production cost: $0.078/unit (materials + labor + utilities). Annual saving vs. outsourcing: ($0.14 − $0.078) × 3,500,000 = $217,000/year. Payback period: $297,000 ÷ $217,000 = 16.4 months. Additional benefits: eliminated $50,000/year in logistics costs, zero supply disruptions in 24 months post-installation, and the ability to launch 7 new tube variants in Year 2 without minimum order penalties — generating $380,000 in incremental new product revenue that year.
Pharmaceutical Packaging Manufacturer: Scaling with Automation
💊 Multi-Machine Investment Strategy
A pharmaceutical packaging contract manufacturer serving OTC topical drug brands needed to double capacity from 18 million to 36+ million tubes per year over 24 months to fulfill a new supply agreement with a major pharma brand. Rather than a single large-system purchase, they adopted a modular multi-machine strategy: two mid-range automated lines with pharmaceutical-grade documentation capability, deployed 12 months apart to allow the first line to generate cash flow before the second capital commitment.
Total investment: $2 × $210,000 = $420,000 in equipment + $65,000 in facility upgrades and validation costs = $485,000 total program cost. Each line was qualified under IQ/OQ/PQ protocols and included in the FDA Drug Master File submission for their pharmaceutical client.
✅ Profitability Metrics and Market Expansion
Combined annual savings versus equivalent outsourcing at their previous contract rates: $680,000/year. Program payback: $485,000 ÷ $680,000 = 8.6 months. The multi-machine validation status unlocked a second pharmaceutical brand supply agreement 18 months into the program, adding $1.2 million in annual contract revenue. The initial $485,000 investment effectively seeded a $3.4 million cumulative revenue expansion over 3 years.
Distributor Success: Offering Tube Mill Solutions to Clients
🤝 Business Model and Revenue Opportunities
A packaging machinery distributor serving Southeast Asian cosmetic manufacturers added Miyoda Packaging Machinery‘s tube production equipment line to their portfolio in 2022. Their value proposition was distinctive: rather than selling equipment as a one-time transaction, they offered a complete “tube production capability package” — equipment supply, facility design consultation, operator training, compliance documentation templates, and a 12-month production optimization agreement with quarterly engineer visits.
✅ Client ROI Achievements and Testimonials
Of their first 14 clients who invested in tube production equipment through this model, 11 achieved payback within their projected timeframe (average 22 months), 2 achieved payback 4–6 months ahead of projection, and 1 required an extended payback of 31 months due to production ramp-up delays. The distributor’s recurring revenue from service agreements and consumable supply generated $180,000 in annual service revenue — a business model transformation from one-time equipment sales to a long-term client partnership with compounding value on both sides. Their average client equipment investment: $185,000; average first-year client savings achieved: $134,000.
10. Making Your Decision: Action Steps and Next Moves
Evaluating Your Current Production Needs
Assessing Current Outsourcing Costs and Pain Points
Start with 12 months of supplier invoices. Calculate total spend, divide by total units received. Add freight, customs, quality-related returns, and emergency air shipment costs separately. That number is your true current outsourcing cost-per-unit — and it is almost always higher than the per-unit price on your supplier’s price list. Document your three most significant outsourcing pain points in the past year (lead time failures, quality issues, price increases, MOQ constraints) and assign a dollar value to each. This exercise typically generates $40,000–$180,000 in documented pain — the most compelling part of any capital approval request.
Forecasting Production Growth Over 5–10 Years
Equipment selection must account for where your production will be in year 5, not just year 1. The cosmetic tube packaging market is growing at 7.2% CAGR through 2034 — a manufacturer growing in line with market would double volume in approximately 10 years. A manufacturer with a strong new product pipeline or new market entry plan could triple volume in 5 years. Build your production forecast with three scenarios — conservative (market growth rate), base (business plan), and optimistic (maximum achievable) — and select equipment capacity at your base case with a clear upgrade pathway to your optimistic case.
Selecting the Right Equipment Partner
Comparing Manufacturers and Machine Specifications
Equipment specification comparison should go beyond the machine datasheet. Key evaluation criteria include: demonstrated performance at reference customer sites producing your specific tube type; availability and lead time of critical spare parts; remote diagnostic capability for troubleshooting; track record with regulatory audits (FDA, CE) at customer facilities; and the engineering team’s depth of knowledge in your specific application — cosmetic soft tube, ABL laminate, or pharmaceutical-grade production each have process nuances that a generalist machine supplier may not fully appreciate.
Explore Miyoda Packaging Machinery’s complete product range — covering tube extrusion lines, laminate tube systems, heading and shoulder machines, capping equipment, and printing systems — to evaluate specifications against your production requirements and receive a comparative analysis from their application team.
Evaluating Support, Training, and Service Agreements
Ask potential equipment suppliers for their mean time to respond (MTTR) commitment for production-critical breakdowns — this is a contractually measurable metric that separates suppliers who genuinely stand behind their equipment from those who provide adequate support during the sales process and disappear afterward. Request references from three clients in your production volume range and call them — specifically about the quality of post-sale support experienced during the first 12 months of operation, which is when process optimization challenges are most frequent and supplier responsiveness most critical.
Creating Your Investment Implementation Plan
Timeline for Equipment Installation and Production Launch
A realistic timeline from equipment purchase order to first commercial production run typically spans 16–26 weeks: equipment manufacturing lead time (8–16 weeks depending on customization level), shipping and customs clearance (2–6 weeks), installation and commissioning (1–2 weeks), operator training (1–2 weeks), and process qualification including trial production runs (2–4 weeks). Planning your inventory bridge — maintaining outsourced tube supply while the in-house line qualifies — requires approximately 60 days of safety stock at your normal consumption rate, funded as working capital that will be eliminated once in-house production is fully operational.
Building Your Financial Model and Securing Approval
A finance-committee-ready capital approval package for a tube mill investment should contain: executive summary (1 page) with investment amount, payback period, 5-year NPV, and strategic rationale; detailed TCO model with all cost assumptions sourced and documented; current outsourcing cost analysis (actual 12-month data); three equipment scenarios with comparative ROI; supply chain risk narrative with quantified disruption history; tax and depreciation analysis; and implementation timeline with milestone-based cash flow projection. Packages structured this way receive approval decisions 40–60% faster than unstructured investment requests, according to manufacturing finance survey data.
Getting Started Today
Request a Personalized ROI Analysis
The most efficient next step is a 30-minute conversation with a tube production equipment specialist who can review your current production volume, outsourcing cost data, and growth projections — and produce a preliminary ROI model calibrated to your actual numbers, not industry averages. This conversation costs you nothing and generates the data framework your financial model needs to be credible at approval stage.
Schedule a Demo and Equipment Consultation
Live or video demonstrations of tube production equipment allow you to evaluate output quality, changeover speed, control system usability, and operator complexity before any purchase commitment. Request that the demonstration run your specific tube specification — your diameter, your material, your print requirements — so you see performance relevant to your production, not a generic showcase scenario. Miyoda Packaging Machinery’s application team regularly provides production demonstrations tailored to customer specifications; contact their team to arrange yours.
Your Path to Profitability Starts with Smart Investment
The financial case for tube mill investment is not subtle. At production volumes above 3–5 million tubes per year, in-house production consistently outperforms outsourcing on a 5-year total cost basis — not by a narrow margin, but typically by $500,000–$1,500,000 in cumulative savings, depending on current outsourcing rates and production scale. The investment pays back faster than most corporate capital approval frameworks require, generates tangible non-financial advantages (supply chain control, quality ownership, speed to market), and creates options — contract manufacturing revenue, premium customization capability, regulatory qualification — that outsourced producers simply cannot access.
The risk of getting the analysis wrong — selecting a machine that underperforms, underestimating facility preparation costs, or overestimating year-one production ramp — is real but manageable through rigorous pre-purchase analysis, reference customer validation, and partnership with an equipment supplier who treats post-sale support as a core product, not an afterthought.
The risk of not acting — continuing to pay supplier margins, absorb supply disruptions, and cede quality control — compounds every year that the decision is deferred. The manufacturers who lead their markets a decade from now are making this investment decision today.
Ready to Calculate Your ROI?
Use our interactive Tube Mill Investment Calculator to see exactly how much you’ll save — or speak with one of our manufacturing specialists to get a customized investment proposal built around your specific production needs and growth plan.
📖 Key Terms Glossary
- TCO (Total Cost of Ownership)
- The complete financial cost of acquiring, operating, and maintaining an asset over its useful life. Includes purchase price, installation, training, labor, materials, maintenance, utilities, and salvage value. The only valid basis for equipment investment comparison.
- Payback Period
- The time required for cumulative savings or income from an investment to equal the total investment cost. Calculated as: Total Investment ÷ Annual Net Savings. Periods below 24 months are considered excellent for manufacturing equipment.
- OEE (Overall Equipment Effectiveness)
- A manufacturing KPI measuring productive machine time as a percentage of planned production time, combining availability rate, performance rate, and quality rate. World-class tube production targets OEE above 85%.
- Section 179 (IRS)
- A US tax provision allowing businesses to immediately deduct the full purchase price of qualifying equipment in the year of acquisition, rather than depreciating it over its useful life. 2025 limit: $2,500,000.
- MOQ (Minimum Order Quantity)
- The smallest quantity a supplier will produce or sell in a single order. High MOQs from contract tube suppliers force over-ordering, creating inventory carrying costs and obsolescence risk — both eliminated by in-house production.
- IQ/OQ/PQ (Installation / Operational / Performance Qualification)
- A three-stage process validation framework used in pharmaceutical manufacturing to document that equipment is correctly installed, operates within specification, and consistently produces compliant product. Required for pharmaceutical-grade tube production qualification.
- NPV (Net Present Value)
- The present value of all future cash flows from an investment, discounted at the cost of capital, minus the initial investment. Positive NPV means the investment creates value above the cost of capital; the higher the NPV, the more financially attractive the investment.
Frequently Asked Questions
What is the typical payback period for a tube mill investment?
Payback periods range from 14 to 48 months depending on your current production volume, existing outsourcing cost per unit, machine type selected, and geographic labor and energy costs. Manufacturers producing above 10 million units per year on a mid-range automated line typically see payback in 18–26 months. Entry-level systems at lower volumes commonly show 36–48 month payback periods. The single most important variable is the gap between your current outsourcing cost per unit and your projected in-house production cost — even a $0.03/unit gap at 5 million units per year generates $150,000 in annual savings that drives rapid payback.
How much does a tube mill system cost for cosmetic or pharmaceutical production?
Cosmetic and pharmaceutical soft tube production systems range from $30,000–$80,000 for entry-level semi-automatic extrusion machines to $100,000–$250,000 for mid-range fully automatic lines capable of 5–20 million tubes per year, and $280,000–$600,000+ for high-speed systems producing 80–300+ tubes per minute. Total all-in cost including installation, tooling, training, and facility preparation typically runs 20–35% above the base machine price. Laminate tube machines (ABL/PBL systems) are generally priced slightly higher than equivalent extruded tube systems due to the precision ultrasonic or hot-air sealing technology required. Request a specific quote from Miyoda Packaging Machinery for your specific tube type and volume requirements.
Is outsourcing tube production actually cheaper than buying a tube mill?
In the short term (Year 1), outsourcing appears cheaper because you avoid the capital investment. Over 3–5 years, in-house production typically delivers 30–50% total cost savings versus outsourcing at market rates — when you include logistics, quality-related rework, rush fees, MOQ overstock carrying costs, and the 8–15% annual price increases that contract tube suppliers have implemented consistently since 2021. The break-even point where cumulative in-house savings exceed the machine investment typically occurs at month 16–28 for manufacturers replacing high-cost outsourcing with volumes above 5 million tubes per year.
What hidden costs should I budget for when buying a tube mill?
The most commonly underbudgeted costs in tube mill investment are: facility preparation (electrical upgrades, HVAC, flooring — $10,000–$90,000 depending on existing infrastructure); tooling and dies for your tube diameter range ($5,000–$20,000 per diameter size); quality control equipment (vision inspection, seal testers, dimensional gauges — $5,000–$20,000); raw material inventory to stock the line ($35,000–$80,000 in working capital at typical production scales); and Year 1 higher-than-normal scrap from process optimization (budget 8–12% scrap in months 1–3, declining to 3–5% by month 6). Including all of these in your capital request prevents budget surprises that undermine the investment’s ROI metrics.
What space do I need for a tube mill installation?
A complete single-line cosmetic tube production operation (extruder, downstream equipment, quality control, raw material staging, finished goods buffer) requires 1,100–1,900 square feet of total floor space. The production equipment itself occupies 500–800 square feet; material and finished goods storage add 500–1,100 square feet depending on inventory levels. Ceiling height of at least 3.5 meters is required for most extruder and downstream configurations. Three-phase power (typically 60–100 kW installed) and compressed air supply (6–8 bar, 150–300 L/min) are standard facility requirements. Most medium-sized cosmetic or pharmaceutical facilities can accommodate a single production line within existing space with minor reconfiguration.
What training is required to operate a cosmetic tube mill?
Operators do not require engineering qualifications — they need mechanical aptitude, good attention to process parameters, and disciplined procedure adherence. Initial competency training takes 1–2 weeks with a machine manufacturer trainer and covers machine startup/shutdown, process parameter setting, product changeover, defect identification, and basic troubleshooting. Most quality equipment suppliers include 5–10 days of on-site training in the equipment package. An important insight from experienced tube producers: investing in training two operators (not one) from the start eliminates single-operator dependency risk and typically pays back through reduced downtime within the first 90 days of production.
Can a tube mill produce multiple tube sizes and materials?
Yes — modern cosmetic tube extrusion and laminate systems are designed for multi-product flexibility. Diameter changeovers (changing from, for example, a 25mm to 35mm tube) require die change and calibration adjustment, taking 30–90 minutes on a well-maintained line. Material changes (switching between LDPE formulations or laminate structures) require purging cycles of 15–40 minutes plus process re-stabilization time. Length changes are typically the fastest: usually a parameter adjustment on the cutting system taking under 5 minutes. The key insight for high-SKU producers: faster changeover time directly improves effective capacity utilization; investing in quick-change tooling systems ($5,000–$15,000 premium) pays back rapidly when you have 6+ SKU variants on a shared production line.
What financing options are available for tube mill purchases?
Multiple financing paths are available for tube mill investment: equipment financing loans (5–7 year terms, 5–12% rates, as little as 10–20% down); operating leases (monthly payments, off-balance-sheet, return or upgrade option at end of term); finance leases (builds equity, lower total cost than operating lease over life); SBA 504 loans for US-based manufacturers (10-year terms, 4–6% effective rate, excellent for equipment above $150,000); and manufacturer-facilitated payment programs that can align cash outflows with production ramp-up milestones. For manufacturers in growth mode with strong cash flow but limited capital, structured equipment financing typically produces better risk-adjusted returns than depleting working capital reserves for an outright purchase.
Can a tube mill help meet pharmaceutical GMP and FDA compliance requirements?
Modern pharmaceutical-grade tube production systems are designed for GMP compliance — they support the documentation, traceability, process control, and validation protocols that FDA and EU GMP Annex 15 require. Key capabilities to verify before purchase: IQ/OQ/PQ documentation templates available from the manufacturer; 21 CFR Part 11-compliant data recording capability for electronic batch records; cleanroom-compatible equipment design (smooth surfaces, no particle-shedding materials); and reference customers who have successfully passed FDA or EMA supplier audits using the same equipment. Miyoda Packaging Machinery can provide compliance-related documentation and has supported pharmaceutical clients through supplier qualification audit processes on their tube production equipment.
What’s the difference between semi-automatic and fully automatic tube mills — and which should I buy?
Semi-automatic systems require operator intervention at multiple process steps (material loading, tube transfer, quality sampling) — they are lower cost ($30,000–$80,000), more flexible for very small batch sizes or high product diversity, and appropriate for volumes under 5 million tubes/year. Fully automatic systems run with minimal operator intervention, achieve 30–150+ tubes per minute continuously, require only 1 operator per shift, and produce more consistent quality through parameter-controlled processing. The right choice depends on your production volume (above 5M/year, fully automatic typically shows better ROI), product variety (high SKU diversity with small batch sizes may favor semi-auto flexibility), and budget. A detailed ROI comparison for your specific scenario — which Miyoda Packaging Machinery’s specialists can provide free of charge — is the definitive way to resolve this decision.
How do I accurately calculate my current outsourcing costs for an ROI comparison?
Pull 12 months of supplier invoices and calculate: (1) base tube cost per unit; (2) freight and logistics costs per unit (divide total annual freight by total units received); (3) customs, duties, and brokerage per unit (same method); (4) quality rejection and rework costs per year (divide by annual units); (5) rush order premiums paid in the period; (6) MOQ overstock that became slow-moving or obsolete (annualized inventory write-off). Sum all six categories and divide by total annual units — this is your true outsourcing cost per unit. Most manufacturers discover their true cost is 15–30% higher than the supplier price list suggests, which materially improves the ROI calculation for in-house production investment.
How can I scale production without compromising quality as volume grows?
Scaling tube production while maintaining quality requires three parallel investments: automation (automated quality inspection systems catch process drift before it becomes a quality failure, independent of production speed), documentation (robust SOP and training systems ensure quality procedures scale with headcount, not degrade), and equipment selection (choosing machines with sufficient capacity headroom — 120–140% of current volume — prevents the quality degradation that comes from running equipment at 100%+ utilization). Manufacturers who add a second production shift before adding a second machine consistently report quality benefits from the lower-intensity single-machine operation compared to running one machine at maximum output. The complete tube machine buyer’s guide from Miyoda Packaging Machinery covers capacity planning frameworks in detail.