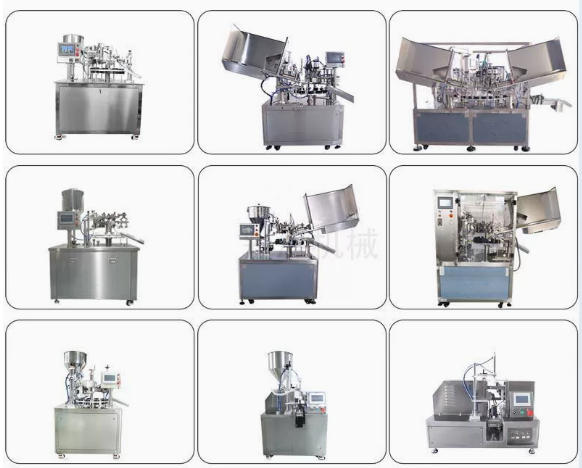

Choosing the right tube filling solution for your cosmetic and pharmaceutical production needs — a data-driven framework for 2026 investment decisions.
Your tube filler is not a peripheral piece of equipment. It sits at the centre of your production line, sets the ceiling for your output, and determines how much of every margin dollar you keep after labor, waste, and rework are deducted.
Choosing between automatic and semi-automatic equipment is one of those decisions that looks straightforward from the outside — until you model the real numbers. A semi-automatic machine costs $20,000. A fully automatic line costs $120,000. That $100,000 gap looks decisive. But over three years at a production volume of 5 million tubes annually, the semi-automatic option costs $220,000 more in total — primarily through labor and waste.
This guide gives you the specific numbers, the decision framework, and the implementation logic to make the right call for your operation — whether you are a cosmetic brand producer, a pharmaceutical contract manufacturer, or a distributor helping clients evaluate their equipment options.
📊 2026 Market Context
The global tube filling machine market was valued at USD 1.2 billion in 2024 and is projected to grow at a CAGR of 5.9% through 2034 (Global Market Insights). The primary growth driver is the migration of cosmetic and pharmaceutical producers from semi-automatic to fully automated lines — a transition driven by rising labor costs, tightening pharmaceutical compliance requirements, and increasing retailer quality audit standards. Understanding where your business sits in this transition is the first step to making the right investment.
Understanding Your Production Volume: The Foundation of Your Decision
How to Calculate Your True Annual Production Needs
The mistake most manufacturers make when sizing filling equipment is using their current average monthly output as the planning number. That is the wrong figure. The right number is your expected peak daily requirement 18 months from now — because that is when your current equipment decision will be tested most severely.
Assessing Current Demand and Growth Projections
Start with a 12-month trailing production log broken down by SKU and month. Identify your three highest-volume months — those are your operational reality, not the average. Then apply your most conservative growth projection for the next 18 months to that peak figure. If your business grew 30% last year and you expect 20% this year, your planning capacity target is not current average plus 20% — it is current peak multiplied by 1.2.
For a cosmetic manufacturer currently producing 3,000 tubes per day at peak with a 20% annual growth expectation, the 18-month planning target is approximately 4,320 tubes per day. Any equipment that cannot reach this output in a single shift is already undersized before installation is complete.
Accounting for Seasonal Fluctuations and Market Expansion
Cosmetic tube demand spikes in Q4 (holiday launches and gifting ranges), Q1 (New Year wellness campaigns), and around major retail promotional cycles. Pharmaceutical tube demand is steadier but can surge sharply when a client launches a new topical product or needs to back-fill a supply gap. Build a minimum 25–30% buffer above your peak projection into your equipment specification — not as a precaution, but as a structural requirement for commercial reliability.
The Hidden Costs of Underestimating Volume Requirements
Why Undersized Equipment Creates Bottlenecks and Lost Revenue
When your filling line becomes the binding constraint on your production schedule, every other investment in your facility — tube printing, sealing, capping, packaging — is working at reduced utilization. A filling bottleneck does not just slow production; it creates cascading inventory imbalances, forces overtime scheduling, and — in its most costly form — forces you to decline orders because you cannot commit to a delivery date.
Track this metric for one quarter: what is the combined value of orders you delayed, reduced, or declined because your filling capacity was the constraint? For most growing tube manufacturers, this exercise reveals $50,000–$200,000 in annual revenue impact from production bottlenecks — value that makes the cost difference between semi-automatic and automatic equipment look modest in comparison.
Real Scenarios: How Manufacturers Missed Growth Opportunities
A contract cosmetics manufacturer in Southeast Asia entered a retail partnership requiring 80,000 tubes per month of a new moisturizer SKU. Their existing semi-automatic line — running two operators across two shifts — had a practical ceiling of 52,000 tubes per month at that tube diameter. Rather than lose the contract, they added a third shift with three additional operators. Within six months, the wage cost of that staffing decision exceeded the depreciation cost of an automatic machine that would have handled the volume in a single shift. The contract was held — but at margins that made it unprofitable.
Scaling Considerations: Building for Tomorrow’s Success
Future-Proofing Without Overspending Today
The right answer is not always “buy the biggest machine available.” It is buying the machine whose economics work at your current volume and whose architecture can accommodate your next growth phase without full replacement. For operations at 2,000–4,000 tubes per day, a well-specified semi-automatic machine with documented upgrade paths — or a capacity-ready production cell that can accept a second semi-automatic unit in parallel — is often the most financially disciplined choice. For operations at 5,000+ tubes per day already, the data consistently points toward automation.
Semi-Automatic Tube Fillers: Ideal Solutions for Growing Brands
When Semi-Automatic Equipment Makes Financial Sense
Budget-Friendly Entry Point for 500–5,000 Tubes Per Day
A semi-automatic tube filling and sealing machine automates the fill, seal, and coding cycle — but relies on an operator to manually load each empty tube onto the mandrel and remove the finished tube from the discharge position. The fill cycle is triggered by foot pedal or proximity sensor after each manual load. Throughput runs between 10 and 40 tubes per minute in real sustained production — approximately 600–2,400 tubes per hour — with actual output heavily dependent on the operator’s experience and the tube format.
Purchase prices range from $8,000 to $35,000 depending on fill volume range, sealing technology (hot-air vs. ultrasonic), and digital controls sophistication. This capital range makes semi-automatic equipment accessible to emerging brands, contract manufacturers building SKU diversity, and growing businesses that need reliable production without a six-figure capital commitment.
Lower Capital Investment With Manageable Labor Costs
The $8,000–$35,000 entry point for semi-automatic equipment funds more than just the machine — it preserves capital for regulatory certification, formulation development, marketing, and market development activities that generate revenue more directly at this production scale. For a brand producing 1,500 tubes per day across four cosmetic SKUs, a semi-automatic machine is the rational equipment choice — provided the labor cost model is understood clearly from the outset.
Operational Realities: Labor Requirements and Staff Training
Realistic Staffing Needs and True Labor Cost Calculation
A single semi-automatic filling line running two shifts requires two dedicated operators per shift — one for tube loading and finished tube handling, one for quality sampling, ink batch changes, and equipment monitoring. At a fully loaded labor cost of $28/hour (wages, benefits, and employer costs), the annual labor cost attributable to a single two-shift semi-automatic line exceeds $115,000 per year. In markets with lower wage rates this figure is smaller — but the throughput ceiling does not change regardless of local labor costs.
This is the number that most equipment cost comparisons omit. When you model a five-year total cost of ownership, the semi-automatic machine’s $20,000 purchase price becomes a relatively small fraction of a $575,000+ five-year operational cost. The machine is not expensive. The people operating it are.
Training Timelines and Reducing Human Error
A new operator can typically reach competent sustained production speed on a semi-automatic tube filler within 1–3 days of structured on-the-job training. The machine’s mechanical simplicity is a genuine advantage here — there are no servo parameters to master, no vision system calibrations to understand, and no PLC alarm trees to diagnose. The primary quality risk on a semi-automatic line is not equipment failure; it is operator-introduced variability in tube positioning and the gradual fatigue that degrades loading consistency during long production runs.
Product Viscosity Flexibility: Your Competitive Advantage
Why Semi-Automatic Fillers Excel With Varying Consistency Products
Semi-automatic machines genuinely outperform automatic systems in one critical operational dimension: viscosity range flexibility. When an operator can manually adjust fill pressure, nozzle speed, and tube positioning for each product change — shifting from a water-thin serum to a thick pharmaceutical paste in the same production day — the adaptability advantage is real. This makes semi-automatic equipment the preferred choice for contract fillers managing 15–30 different SKUs per week with batch sizes of 500–3,000 tubes each.
Quick Adjustments for Product Line Diversification
Switching between a 30mm diameter cosmetic cream tube and a 40mm laminate pharmaceutical ointment tube on a semi-automatic machine typically requires swapping the filling nozzle and adjusting sealing jaw clearance — completing in 15–25 minutes without specialized tooling. This format agility is a commercial advantage for businesses where product diversity is the value proposition, not volume throughput.
Quality Control and Consistency Challenges
Maintaining Fill Accuracy With Manual Intervention Points
Semi-automatic machines achieve fill weight accuracy of 1–2% by volume — corresponding to a Process Capability Index (Cpk, a statistical measure of how consistently a filling process hits its target weight within specification limits; pharmaceutical standards typically require Cpk ≥ 1.33) of approximately 0.9–1.2. This is adequate for most cosmetic applications. For pharmaceutical products requiring tight fill tolerances — where under-fill can mean under-dosage and over-fill means wasted active ingredient — this accuracy level requires exceptional operator discipline and more frequent in-process weight checks to maintain compliance.
Minimizing Waste and Ensuring Regulatory Compliance
Rejection rates on semi-automatic lines for fill weight non-conformance typically run 1.5–3.0% of output. At a production volume of 50,000 tubes per month and a product cost of $1.50 per filled tube, this means $1,125–$2,250 in monthly material waste from fill accuracy alone. Multiplied across 12 months, this is $13,500–$27,000 in annual waste — a cost that scales directly with production volume and that automatic systems reduce by 60–80%.
Automatic Tube Fillers: Maximum Efficiency for High-Volume Production
🎬 Watch: High-Speed Automatic 2-Head Tube Filling & Sealing Machine in Production
Note the continuous rotary indexing cycle, bulk tube in-feed orientation, servo-driven fill station, and automated sealing — zero manual contact per tube throughout the production sequence.
When Automatic Systems Deliver Real Value
Production Volumes Where Automation Saves Money
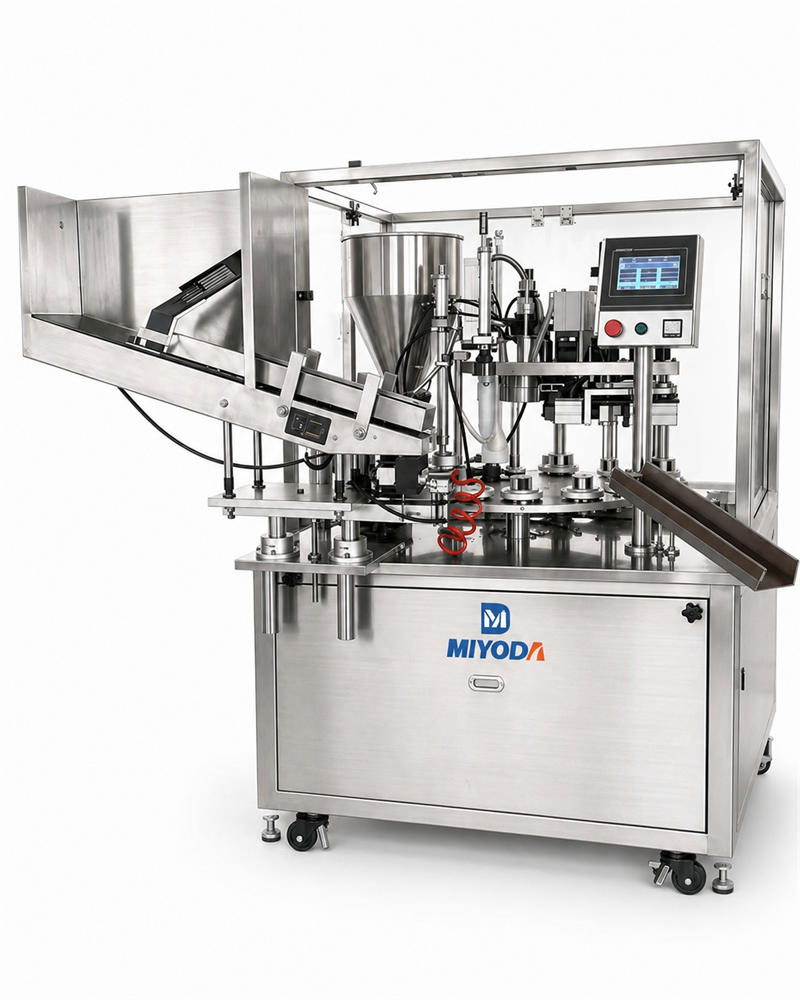
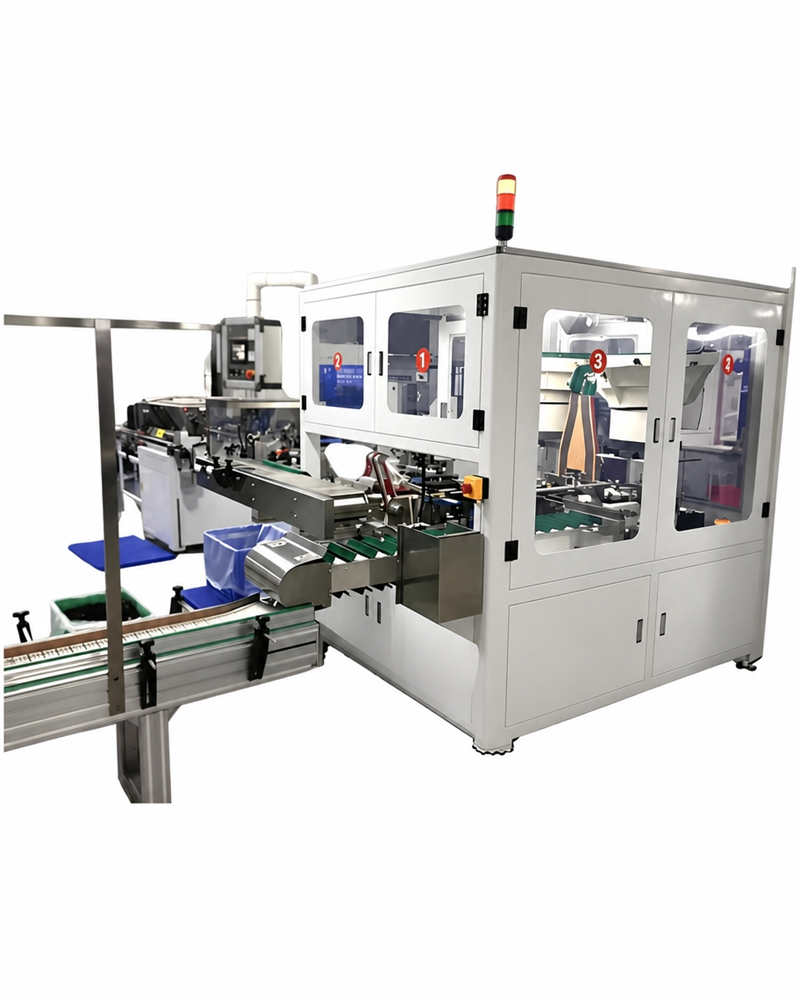
A fully automatic tube filling machine handles the complete production cycle without per-tube operator intervention. Empty tubes load in bulk into a hopper or rotary magazine; a servo-driven indexing mechanism moves them through orientation, filling, sealing, batch coding, and finished-tube ejection. Modern automatic systems cycle at 60–200+ tubes per minute, delivering 3,600–12,000 tubes per hour with fill weight accuracy within 0.3–0.5% by volume.
A single-head automatic machine running at 80 tubes per minute delivers approximately 38,400 finished, sealed, and coded tubes per 8-hour shift. A dual-head system at 120 tpm reaches 57,600 per shift. At a 20-shift month, a mid-range automatic system delivers over 1.1 million tubes per month — output that would require six semi-automatic machines and twelve operators to replicate.
Reducing Labor Dependency and Stabilizing Operational Costs
Where a semi-automatic line requires 1–2 operators per machine per shift, a fully automatic system requires one technician to monitor multiple lines. At a fully loaded technician cost of $45,000–$55,000 annually (higher skill, higher wage than a manual operator), the labor cost for an automatic line running two shifts is $45,000–$55,000 total — versus $115,000–$160,000 for an equivalent semi-automatic operation. This difference alone — $60,000–$105,000 per year — is the primary economic driver behind every automatic equipment investment.
Capital Investment vs. Long-Term Savings
| Cost Factor | Semi-Automatic | Fully Automatic |
|---|---|---|
| 機械の購入価格 | $8,000–$35,000 | $60,000–$250,000+ |
| Annual Labor (2 shifts) | $115,000–$160,000 | $28,000–$55,000 |
| Annual Preventive Maintenance | $2,000–$6,000 | $8,000–$20,000 |
| Fill Weight Rejection Rate | 1.5%–3.0% of output | 0.1%–0.5% of output |
| Annual Throughput Ceiling | ~3–5 million tubes | ~10–25 million tubes |
| Fill Weight Cpk | 0.9–1.2 typical | 1.5–2.0 typical |
| GMP Data Compliance Cost | High — manual SOP investment required | Built-in: alarms, fill logs, audit trail |
| Typical ROI Payback Period | 6–18 months | 18–36 months |
The 3-Year TCO Reality at High Production Volume
At a production volume of 5–8 million tubes per year, the 3-year total cost of ownership for a semi-automatic operation is approximately $540,000. For a fully automatic line at the same volume, it is approximately $320,000 — a $220,000 saving over three years despite the automatic line costing $60,000–$100,000 more to purchase.
The breakdown is unambiguous: labor consumes 57% of the semi-automatic operation’s three-year cost ($308,000), while representing only 41% ($131,000) of the automatic line’s total. The machine purchase price is a relatively small percentage of either figure. The equipment investment conversation is fundamentally a labor and waste conversation wearing a capital expense label.
Superior Consistency and Regulatory Advantages
Meeting Pharmaceutical and Cosmetic Packaging Standards With Precision Filling
A pharmaceutical manufacturer filling 50ml topical ointment tubes reported that migrating from a semi-automatic to an automatic rotary system reduced fill weight variance rejection from 1.8% to 0.18% — recovering approximately 900kg of product per month. At a formulation cost of $180/kg for the active pharmaceutical ingredient, this waste reduction alone was worth $162,000 annually. The machine paid for itself in product savings before labor savings were calculated.
For pharmaceutical tube operations operating under FDA cGMP regulations, automatic systems offer a structural compliance advantage: built-in electronic batch records, real-time fill weight monitoring, alarm-triggered production stops, and SCADA-compatible data interfaces that generate the pharmaceutical batch records required by 21 CFR Part 211.192 automatically — rather than through manual documentation processes that depend on operator discipline.
Reducing Product Waste and Improving Batch Consistency
Automatic systems typically reduce product waste by 30–50% compared to semi-automatic operations at equivalent volumes. This matters beyond cost: in pharmaceutical manufacturing, every gram of active ingredient lost to over-fill is a compliantly produced product that never reaches a patient. In prestige cosmetics, fill consistency is directly visible to the end consumer — a tube that feels noticeably lighter than its labeled weight damages brand perception at the moment of repurchase.
Integration With Your Existing Production Line
Seamless Connectivity With Capping, Labeling, and Packaging Equipment
Fully automatic tube filling machines integrate directly with upstream product tanks and downstream capping, labeling, and cartoning equipment via PLC (Programmable Logic Controller — the industrial computer that controls production line equipment and manages communication between machines) handshake signals. This eliminates the manual staging buffers that semi-automatic setups require between each process step — buffers that introduce contamination risk, reduce throughput, and add handling labor that does not appear in a simple equipment cost comparison.
For operations building or rebuilding complete tube packaging lines, sourcing the filling machine and downstream equipment from an integrated supplier — as Miyoda Packaging Machinery structures its complete tube production line solutions — significantly reduces integration complexity and clarifies support accountability when issues arise.
Budget Constraints: Making Smart Financial Decisions

Breaking Down the True Cost of Ownership
Equipment Purchase Price vs. Operational Expenses
The purchase price of a tube filling machine represents 22–25% of a five-year total cost of ownership at typical production volumes. The remaining 75–78% is operational: labor, consumables, maintenance, and quality-related waste. This ratio means that a manufacturer who selects a machine primarily on purchase price — optimizing the 22–25% while ignoring the 75–78% — is making a financially backwards decision.
True cost of ownership over five years at 5 million tubes annually:
| 費用区分 | Semi-Auto (5yr) | Fully Auto (5yr) | Difference |
|---|---|---|---|
| Machine Purchase + Installation | $30,000 | $100,000 | +$70,000 |
| Labor (5 years, 2 shifts) | $575,000 | $220,000 | –$355,000 |
| Maintenance (5 years) | $20,000 | $65,000 | +$45,000 |
| Product Waste (fill rejection) | $112,500 | $18,750 | –$93,750 |
| 5-Year Total Cost | $737,500 | $403,750 | –$333,750 |
Illustrative estimates at 5M tubes/year, 2-shift operation, $28/hr fully-loaded operator cost, $1.50/tube product value at 2.0% vs 0.25% waste rates. Actual figures vary by region, product, and tube format.
Hidden Expenses: Training, Spare Parts, and Technical Support
Budget the following additional costs before finalizing any equipment investment: installation and commissioning ($2,000–$8,000 for semi-automatic; $5,000–$15,000 for automatic); initial operator training ($1,500–$5,000 depending on supplier and scope); pharmaceutical validation activities (IQ/OQ/PQ — $10,000–$30,000 if required); annual spare parts inventory (5–10% of equipment purchase price as a reserve); and technical support contract ($3,000–$12,000 annually for automatic systems). These costs are real, they are predictable, and they belong in your ROI model from day one.
Financing Options and ROI Timelines
Lease vs. Buy Scenarios for Different Business Sizes
Equipment leasing — where you pay a monthly fee for equipment use over a 3–5 year term rather than purchasing outright — preserves working capital and provides upgrade flexibility at term end. For a growing cosmetic manufacturer committing to a $120,000 automatic tube filler, a 48-month equipment lease at typical financing terms results in monthly payments of approximately $2,800–$3,200 — an obligation that, for most operations at 5,000+ tubes per day, is comfortably covered by the monthly labor savings generated from the first month of operation.
Calculating Payback Periods Based on Your Actual Volume
Your payback period calculation: (Automatic machine cost – Semi-automatic machine cost) ÷ (Annual labor saving + Annual waste saving – Annual maintenance difference). At 5 million tubes per year with US labor rates, this calculation typically produces a payback of 18–24 months. At 10 million tubes per year, it compresses to 12~18か月. Below 2 million tubes per year, payback extends beyond 36 months — and the semi-automatic option is financially rational until volume grows.
Cost-Per-Unit Analysis: Your Real Profitability Metric
Calculating True Filling Cost Per Tube
True filling cost per tube = (Annual equipment depreciation + Annual labor + Annual maintenance + Annual waste cost + Annual overhead allocation) ÷ Annual production volume. Using this formula at 5 million tubes annually:
- Semi-automatic: approximately $0.15–$0.25 per tube at this volume
- Fully automatic: approximately $0.06–$0.10 per tube at this volume
- Fully automatic at 15 million tubes/year: approximately $0.03–$0.06 per tube
This cost-per-unit difference — $0.09–$0.19 per tube — compresses or eliminates the margin advantage of lower-priced suppliers and creates the competitive headroom to win contracts based on price flexibility. At scale, the filling cost difference between systems is not an operational metric; it is a competitive strategy.
Product Viscosity: Matching Equipment to Your Formulations
Assessing Your Viscosity Range and Current Challenges
Common Issues With Standard Fillers for Thick Products
Viscosity (the measure of a fluid’s resistance to flow, expressed in centipoise (cP); water is 1 cP, typical hand lotion is 2,000–5,000 cP, and a thick pharmaceutical ointment can exceed 50,000 cP) is the specification that determines your pump type, fill cycle time, and the design requirements of your tube filling machine. Getting this wrong at the specification stage means discovering at first production that your machine cannot consistently fill your product — a discovery that typically costs $5,000–$20,000 in rework, reformulation, or emergency equipment modification.
Standard peristaltic pump fillers — common on entry-level semi-automatic machines — perform reliably up to approximately 10,000–15,000 cP. Above this threshold, fill cycle times extend, air entrapment in the product becomes an issue, and fill weight consistency deteriorates. High-viscosity cosmetic and pharmaceutical products — thick face creams, heavy pharmaceutical ointments, adhesive gels, and dental pastes — require piston pump systems with heated product hoppers and pressure-assisted filling to deliver consistent results.
Why One-Size-Fits-All Equipment Fails Complex Formulations
A contract manufacturer discovered this precisely: switching from a water-based facial serum (viscosity ~500 cP) to a petrolatum-based pharmaceutical cream (viscosity ~35,000 cP) on the same semi-automatic peristaltic pump filler resulted in fill weight variance jumping from 0.8% to 4.2% — three times above the pharmaceutical client’s acceptance limit. The machine was not faulty. It was simply not specified for the product. A piston pump system with jacketed hopper heating would have handled both products — but only if the viscosity range had been part of the original specification discussion.
Semi-Automatic Advantages for Viscosity Variety
Manual Adjustments That Accommodate an Evolving Product Line
For operations managing five or more products with significantly different viscosity profiles, semi-automatic equipment provides a genuine operational advantage: an experienced operator can manually adjust fill pressure, speed, and nozzle dwell time between products in ways that automatic recipe systems take longer to optimize. This hands-on adaptability is particularly valuable for R&D and pilot-scale production, where formulations are still being refined and fill performance data is being generated for scale-up planning.
Automatic Systems for Consistent Thick-Product Performance
Advanced Pump Technology for High-Viscosity Pharmaceutical Products
Modern automatic tube filling machines designed for high-viscosity applications incorporate servo-controlled piston pumps with variable stroke, jacketed stainless steel product hoppers (maintaining product temperature to control viscosity consistency throughout the fill run), vacuum de-aeration systems (removing trapped air from the product before filling to prevent voiding and under-weight tubes), and programmable nozzle withdrawal speeds that prevent product drips and tail contamination. These design features allow consistent filling of products at 5,000–100,000+ cP — covering the full range of cosmetic creams, pharmaceutical ointments, toothpastes, and specialty medical device gels.
Testing Before Commitment: Validation and Compatibility
Before committing to any tube filling machine purchase, require a Factory Acceptance Test (FAT — a documented production test conducted at the manufacturer’s facility using your actual product and tube format before shipment) using your actual formulations at your specified fill volumes. Reputable suppliers offer this as standard. It is not a negotiation point — it is a technical requirement. Any supplier who cannot or will not run a witnessed FAT with your actual product should be removed from consideration. The cost of discovering a viscosity incompatibility after installation — in downtime, travel for technical support, and production delays — vastly exceeds the inconvenience of requiring a pre-shipment test.
Regulatory Compliance and Quality Assurance

Understanding Your Industry Standards
FDA, EU, and International Requirements for Tube Packaging
For cosmetic tube manufacturers selling in the US market, FDA cosmetic regulations under 21 CFR Part 701 require accurate labeling of fill quantity and product identity. Fill weight accuracy is therefore a direct regulatory requirement — not merely a quality standard. EU cosmetic regulation EC 1223/2009 imposes similar requirements on net content labeling.
For pharmaceutical tube manufacturers, the compliance picture is significantly more demanding. GMP requirements for pharmaceutical packaging mandate product-contact materials that meet 316L stainless steel standards, validated cleaning procedures between products, documented calibration records for all fill measurement systems, electronic or formally controlled batch records for every production run, and equipment qualification (IQ/OQ/PQ) before first pharmaceutical use. These requirements exist in both FDA (US) and EMA (European Medicines Agency) jurisdictions, and in WHO guidelines that govern pharmaceutical manufacturing in most other markets.
Compliance Advantages of Each System
Semi-Automatic: Flexibility for Small-Batch Compliance
Semi-automatic equipment can meet GMP requirements for pharmaceutical tube filling — but it requires significantly greater procedural infrastructure to do so. Manual batch records must be completed accurately for every production cycle, cleaning procedures must be validated with documented evidence of contamination removal below specified limits, and fill weight checks must occur at defined frequencies with results entered into formal batch records. This is achievable with disciplined teams, but the compliance burden is substantially higher than with automatic systems where most of this documentation is generated automatically.
Automatic Systems: Built-In Documentation and Audit Trail
Automatic tube filling systems designed for pharmaceutical use include SCADA-compatible data interfaces that generate real-time fill weight logs, alarm records, and operator action logs that constitute a 21 CFR Part 11-compliant electronic batch record. When a pharmaceutical client’s quality team audits your facility — or when an FDA inspector reviews your production records — an automatic system produces the documentation trail automatically. On a semi-automatic line, that same documentation is produced manually, page by page, and its completeness depends on operator discipline under production pressure. The compliance risk difference between these two approaches is not theoretical — it is the difference between passing and failing a pharmaceutical client audit.
Reducing Waste and Protecting Your Margins
How Precision Filling Directly Impacts Profitability
Automatic systems reduce product waste by 30–50% through precision servo-driven filling. At a production volume of 10 million tubes annually with an average product cost of $0.80 per tube, reducing waste from 2.0% to 0.25% saves $140,000 in product cost annually — before any labor or compliance savings are counted. This waste reduction also directly supports sustainability commitments increasingly demanded by retail buyers and pharmaceutical clients, who track supplier environmental performance as part of their vendor qualification process.
Implementation Timeline and Transition Strategy
Planning Your Equipment Installation Without Production Disruption
Realistic Timelines From Purchase Decision to Full Operational Capacity
| Phase | Semi-Automatic | Fully Automatic |
|---|---|---|
| Specification and supplier selection | 2–4 weeks | 4–8 weeks |
| FAT (Factory Acceptance Test) and approval | Optional (1–2 days) | Recommended (3–5 days) |
| Lead time / manufacturing | 4–10 weeks | 10–20 weeks |
| Installation and commissioning | 1–2 days | 3–7 days |
| Operator training | 1–3 days | 2–4 weeks |
| Pharmaceutical IQ/OQ/PQ validation | 4–12 weeks (if required) | 8–24 weeks (if required) |
| Total to Full Production | 6–16 weeks | 16–40 weeks |
Managing Parallel Production During Transition
The most operationally reliable transition strategy is running your existing production system in parallel with the new equipment during the first 2–4 weeks of commissioning. This means your existing customer commitments are not hostage to the new machine’s learning curve, and your team has the operational safety net of the familiar process while developing confidence with the new system. Plan for 25–40% reduced aggregate capacity during the transition period and communicate proactively with any clients whose orders will be affected by timing.
Performance Benchmarking: Measuring Success
Setting Realistic KPIs for the First Year
The four metrics that reveal whether your filling equipment investment is performing as planned: OEE (Overall Equipment Effectiveness — Availability × Performance × Quality; world-class is 85%+; expect 65–75% in month one and 80–85% by month six for automatic lines); fill weight Cpk (target ≥1.33 for cosmetic; ≥1.67 for pharmaceutical); waste rate (reject and rework tubes as percentage of total output); and cost per tube calculated monthly using actual labor, material, and maintenance figures. Track all four from day one — not after the ROI review at 12 months.
Partnering With the Right Equipment Provider
Evaluating Supplier Reliability and Support
What to Look for in Technical Support and Spare Parts Availability
The correct question when evaluating a tube filling equipment supplier is not “how much does it cost?” It is: “What happens at 11pm on a Thursday when my filling line is down and my biggest client’s order ships Friday morning?” The answer to that question reveals the true cost of a supplier relationship. Budget 5–10% of equipment purchase price annually for planned maintenance — and add a significant contingency for unplanned downtime unless your supplier can demonstrate documented response time commitments and local spare parts availability.
For an integrated assessment of what supplier technical support should look like in practice, the Miyoda Packaging Machinery tube filling and sealing machine guide details the support infrastructure, validation documentation, and commissioning protocols that differentiate serious equipment partners from transactional suppliers.
Why Choosing the Wrong Supplier Costs More Than Equipment
A pharmaceutical tube manufacturer in Europe invested $180,000 in an automatic filling line from an unknown supplier offering a 20% price advantage. Within 14 months, three servo failures occurred — each requiring 3–5 day lead times for parts from overseas. Total unplanned downtime across the three incidents: 11 days. At $2,000/hour production value, the downtime cost exceeded $176,000 — negating the purchase price saving and then some. The selection criterion of “cheapest quote” delivered the most expensive machine.
Long-Term Relationship Benefits
Scalability Options and Upgrade Paths
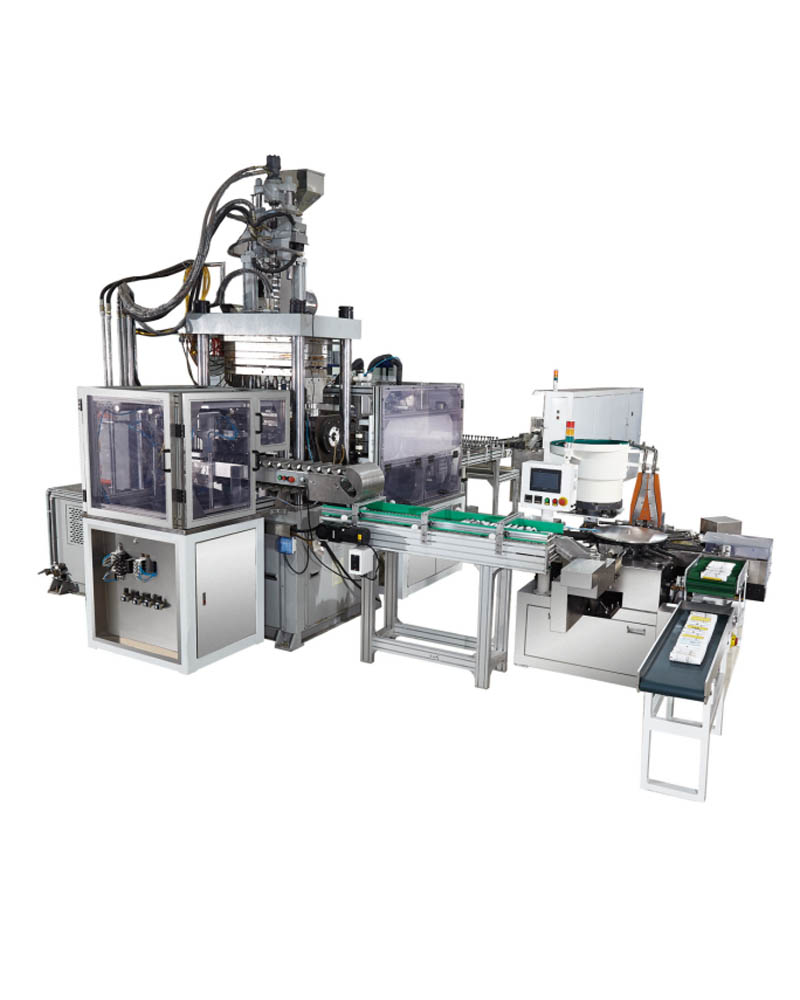
Suppliers who engineer tube filling machines as part of complete production line systems — including upstream tube production equipment and downstream sealing, capping, and packaging machinery — offer a meaningful long-term advantage: when your production grows and requires an upgrade, the integration work between a new filling machine and your existing line equipment is dramatically simpler when both were designed by the same engineering team.
Miyoda Packaging Machinery’s approach to complete cosmetic and toothpaste tube filling line configuration is built around exactly this continuity — from tube extrusion through filling, sealing, and capping, with each stage engineered for mechanical and PLC compatibility with the others.
Red Flags to Avoid in Equipment Partnerships
Suppliers who will not provide direct references from comparable clients (same industry, similar production volume, same tube formats) are telling you something important about their track record. Suppliers who cannot provide GMP validation documentation templates — the User Requirement Specification (URS), IQ/OQ/PQ protocol frameworks — for pharmaceutical applications are not experienced in regulated manufacturing environments, regardless of what their brochure says. And suppliers who offer no-cost service contracts with no clear escalation procedure and no local parts inventory are offering security theater, not production continuity.
2026 Market Trends and Future-Ready Decisions
Emerging Technologies in Tube Filling Equipment
Industry 4.0 Integration and Data-Driven Production
Industry 4.0 refers to the integration of digital data systems, real-time machine monitoring, and automated production optimization into industrial manufacturing — an architecture that modern tube filling equipment is increasingly built around. For tube filling and sealing machines, this translates practically into: OPC-UA data interfaces that connect filling machine output data to plant-level manufacturing execution systems (MES); AI-assisted fill weight prediction that adjusts piston stroke parameters in real time based on product viscosity drift during a production run; and predictive maintenance alerts that identify bearing wear or seal degradation before they cause production stoppages.
For pharmaceutical manufacturers, this data integration capability is not a feature — it is increasingly an audit expectation. Clients and regulatory inspectors reviewing electronic batch records in 2026 expect to see not just that the machine was calibrated, but real-time fill weight data demonstrating process capability throughout the production run.
Sustainability Features Aligned With Consumer Demand
Automatic tube filling systems are inherently more sustainable than semi-automatic alternatives at equivalent output — they waste 30–50% less product, consume less energy per tube through optimized servo drive systems, and reduce cleaning chemical consumption through integrated CIP (Clean-in-Place — automated chemical flushing of product-contact surfaces without disassembly) circuits. These advantages align with the sustainability expectations that major cosmetic retailers and pharmaceutical companies now include in their supplier qualification criteria — making the sustainability case for automation an additional commercial argument beyond the financial one.
Market Predictions for Cosmetic and Pharmaceutical Packaging
Growing Demand for Customization and Small-Batch Flexibility
その global tube filling machine market is projected to grow at 5.9% CAGR through 2034, driven by two simultaneous and apparently contradictory trends: increasing automation for core volume SKUs, and increasing demand for small-batch customization capability for limited edition and personalization-driven cosmetic launches. The most successful operations in 2026 and beyond will deploy automatic filling lines for their core volume products while maintaining flexible semi-automatic capacity for launches, pilot batches, and high-customization clients — not choosing one or the other.
Making a Future-Proof Investment Today
Building Flexibility Without Overcommitting Capital
The equipment decision most likely to remain financially sound across market fluctuations is the one that matches your current production economics honestly — not your most optimistic growth projection. If your honest 18-month production forecast sits at 2 million tubes per year, invest in a high-quality semi-automatic system with a documented upgrade path to automatic, not an undersized automatic machine that strains its performance envelope from day one. If your forecast is 6 million tubes per year, the automatic investment is not ambitious — it is conservative.
Your Path to the Right Equipment Decision
The right tube filler is not the most expensive one. It is not the cheapest. It is the one whose economics match your production reality — and whose operational design supports your quality, compliance, and growth requirements for the next decade.
By modelling your true annual production requirement, your five-year total cost of ownership, your compliance obligations, and your viscosity profile before comparing machine prices, you transform this from a purchase decision into a strategic investment. Manufacturers who make this decision analytically — using actual cost per tube data rather than sticker price comparisons — consistently outcompete those who do not, because they build production economics that their market position can defend.
🎯 Quick Decision Summary
✅ Choose Semi-Automatic If:
- Under 5,000 tubes per day
- High SKU diversity, small batches
- Limited capital (< $40,000 available)
- Contract filling with 15+ SKUs
- R&D and pilot-scale production
- Wide viscosity range flexibility needed
⚙️ Choose Fully Automatic If:
- 5,000+ tubes per day consistently
- Pharmaceutical GMP compliance required
- Labor cost is a strategic concern
- Fill weight Cpk ≥1.33 demanded by clients
- Electronic batch records are mandatory
- Core SKUs at high, stable volume
Get Your Customized Equipment Assessment
Don’t guess about your equipment needs. The specialists at Miyoda Packaging Machinery work with cosmetic and pharmaceutical tube manufacturers to analyze your specific production requirements — fill volume, viscosity profile, compliance obligations, and growth trajectory — and recommend the filling solution that maximizes your profitability in 2026.
📖 重要用語集
- Cpk (Process Capability Index)
- A statistical measure of how consistently a filling process hits its target weight within specification limits. Cosmetic standard: Cpk ≥1.0. Pharmaceutical standard: Cpk ≥1.33. Automatic systems typically achieve 1.5–2.0; semi-automatic 0.9–1.2.
- OEE(総合設備効率)
- Availability × Performance × Quality. The benchmark for production efficiency. World-class is 85%+. Automatic tube fillers typically achieve 80–90%; semi-automatic 70–80%.
- CIP (Clean-in-Place)
- Automated chemical flushing of product-contact surfaces without disassembly. Critical for pharmaceutical cleaning validation and rapid product changeover.
- FAT (Factory Acceptance Test)
- A documented production test conducted at the equipment manufacturer’s facility using your actual product and tube format before shipment. Non-negotiable for pharmaceutical equipment purchases.
- IQ/OQ/PQ
- Installation / Operational / Performance Qualification — the three-phase validation protocol for pharmaceutical manufacturing equipment confirming correct installation, correct operation within specified parameters, and consistent performance in production.
- Viscosity (cP — centipoise)
- The measure of a fluid’s resistance to flow. Water: 1 cP. Hand lotion: 2,000–5,000 cP. Thick pharmaceutical ointment: 30,000–100,000 cP. Determines pump type, fill cycle time, and equipment design requirements.
- TCO(総所有コスト)
- The complete financial cost of owning and operating equipment over its working life — including purchase, installation, labor, maintenance, waste, and quality costs. The correct basis for equipment investment decisions.
- ABL / PBL (Aluminum / Plastic Barrier Laminate)
- Multi-layer tube constructions providing oxygen and moisture barrier protection for sensitive cosmetic and pharmaceutical formulations. ABL uses an aluminum foil core; PBL uses plastic barrier layers.
よくある質問
Grounded in operational data from cosmetic and pharmaceutical tube filling operations worldwide.