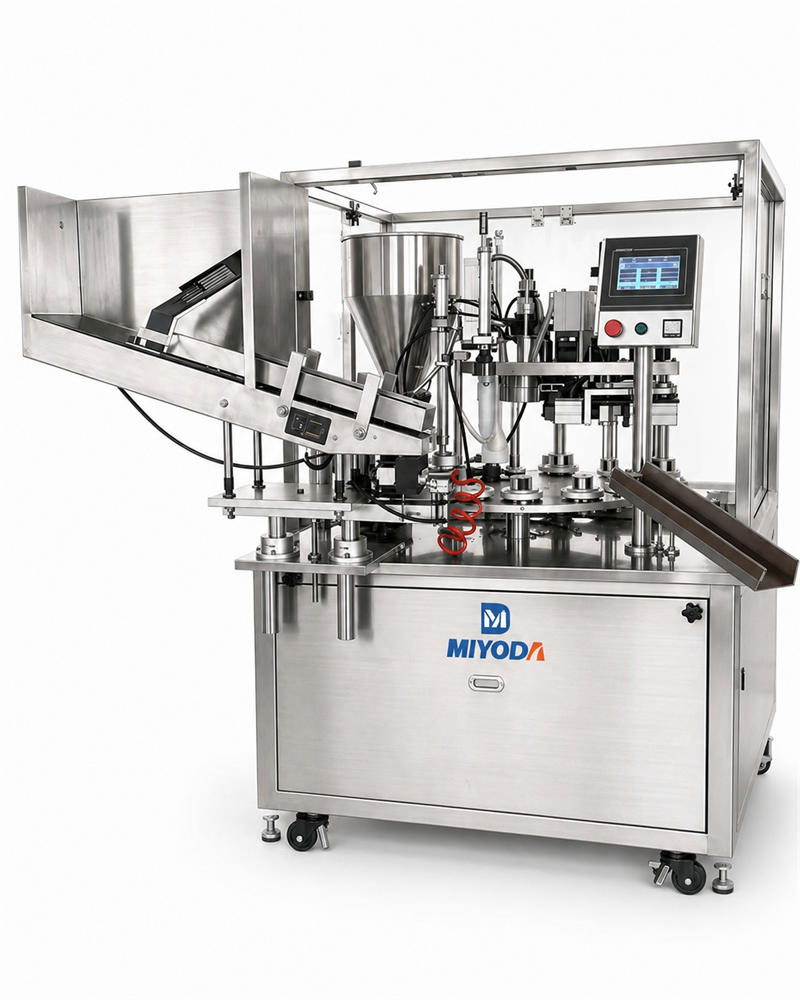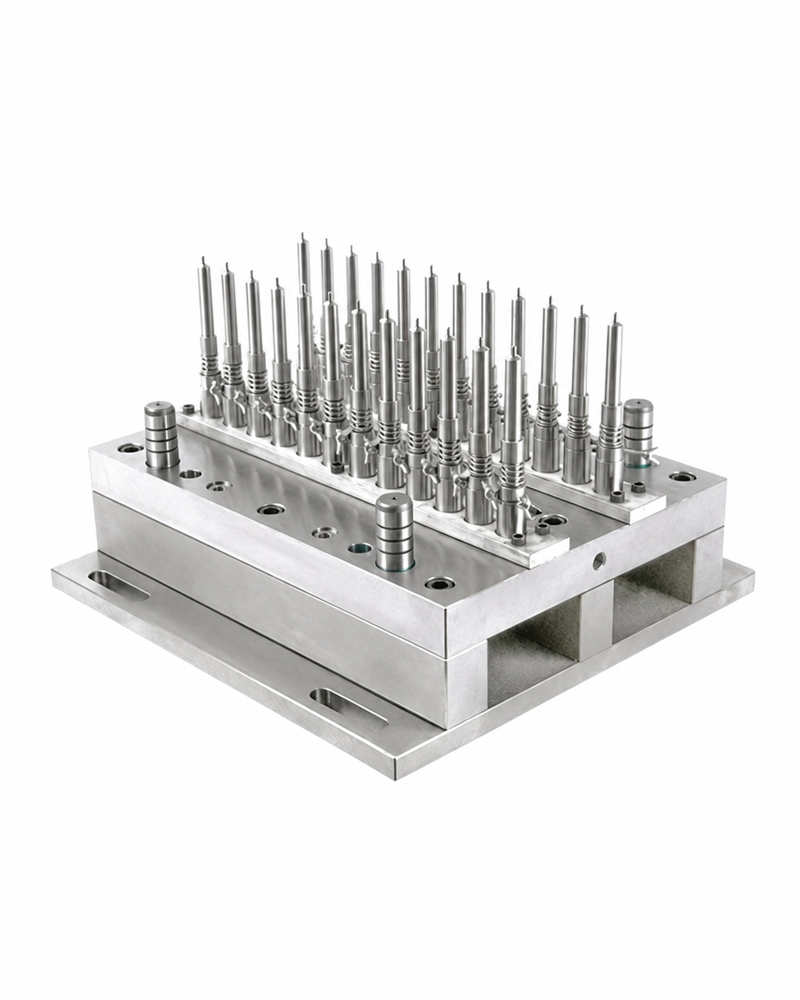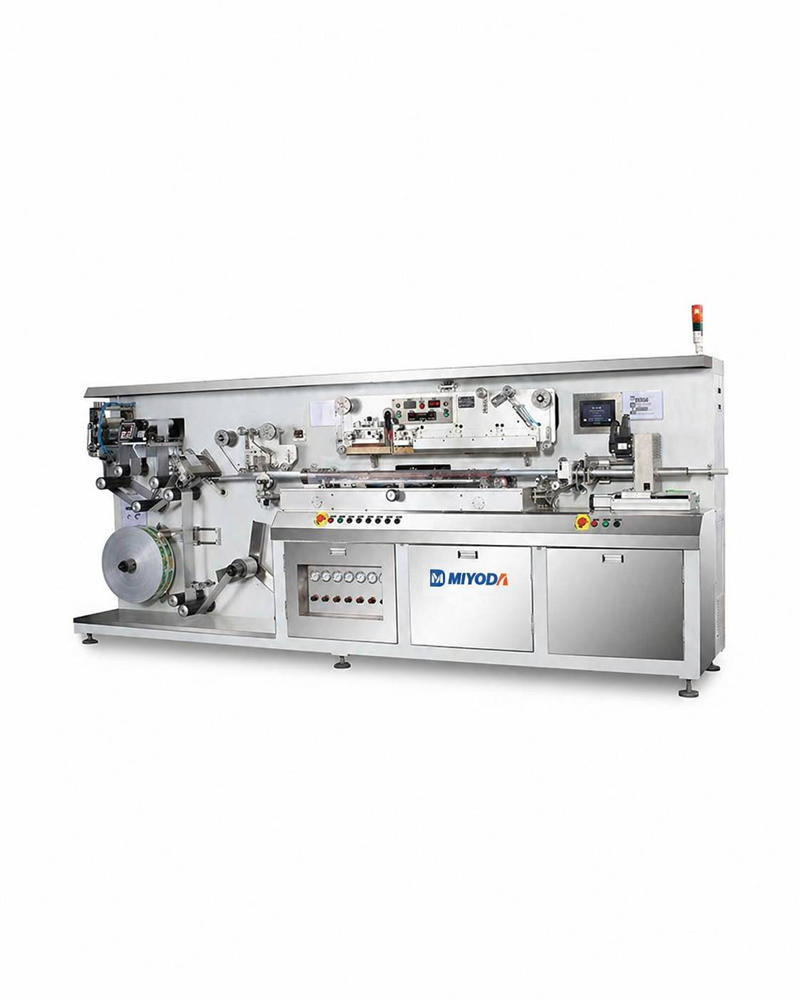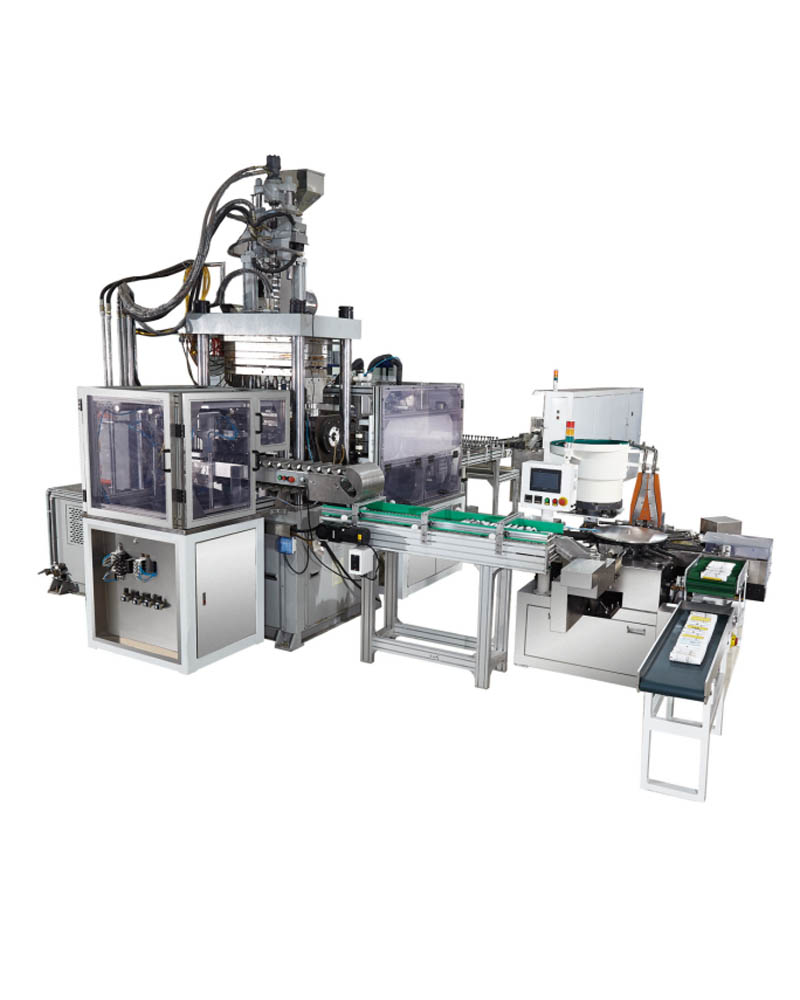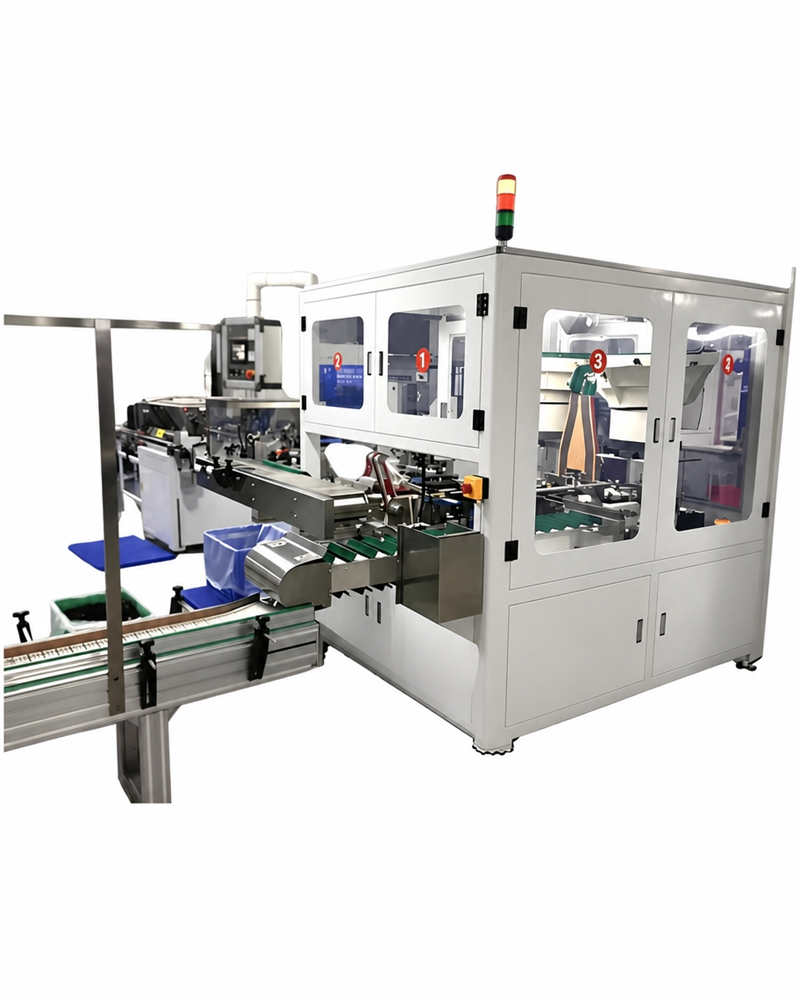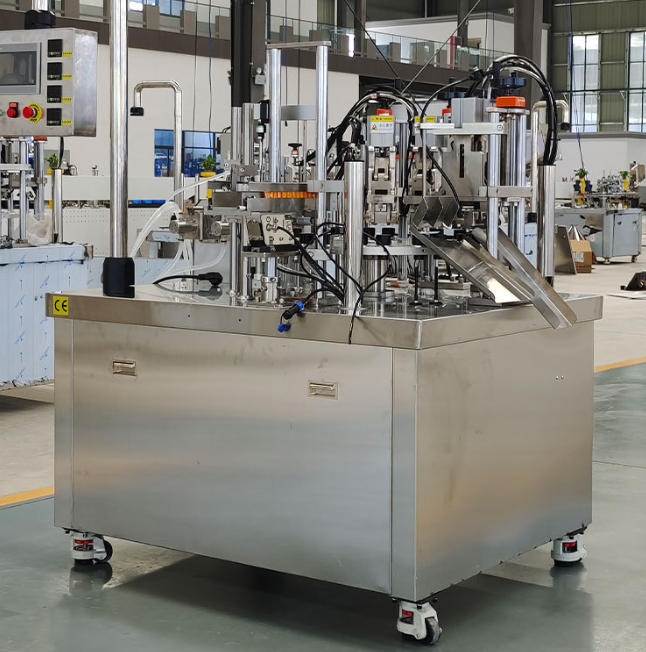
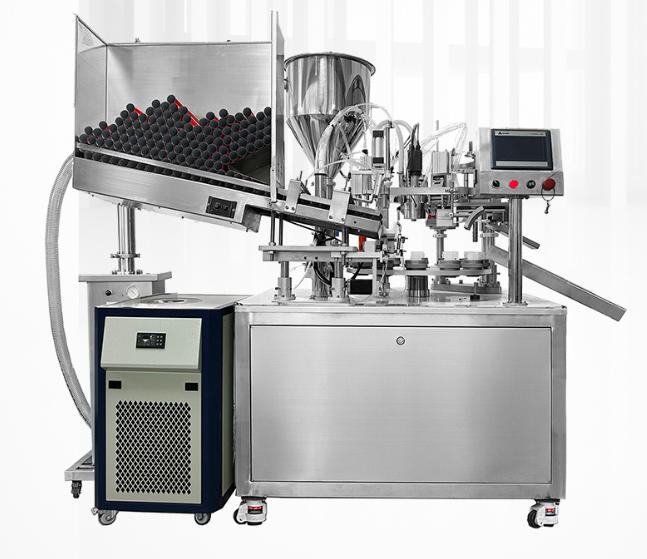
Manual tube filling: what looks like a simple process is quietly compounding cost at every station.
Stop Losing Money to Manual Tube Filling Inefficiencies — Discover the Real ROI of Automation and Make the Smart Investment Decision for Your Cosmetic and Pharmaceutical Packaging Business
Why Manual Tube Filling Is Costing You More Than You Think
You already know your machine cost. You probably know your tube cost and your raw material cost. But do you know your true cost per tube produced?
Most manufacturers running manual or semi-automatic tube filling lines don’t — because the costs that matter most aren’t on any invoice. They’re embedded in your payroll, scattered across your rework queue, absorbed into your reject bin, and hidden in the overtime your team worked last Thursday to meet a deadline.
Here is the reality: manual filling accuracy sits at 85–90% in sustained production, meaning 2–8% of your product routinely ends up as waste rather than shipped, sold product. Labor costs account for 30–40% of total manufacturing costs on non-automated packaging lines. A single FDA warning letter that leads to a batch recall costs a mid-size pharmaceutical company between $2 million and $10 million — and most of the documentation gaps that trigger those letters are created directly by manual process variability.
This guide exists to put numbers on what you’ve been absorbing as “the cost of doing business.” Because the real question isn’t whether you can afford to automate. It’s whether you can afford not to.
1. The True Labor Costs Behind Manual Tube Filling Operations
Understanding Direct and Indirect Labor Expenses
The most visible labor cost is the wage you pay the operator standing at the filling station. What most manufacturers don’t capture is everything surrounding that wage.
At a blended US labor rate of $22/hour, a single tube filling operator costs far more than $22 per working hour. Add employer payroll taxes (7.65% FICA), workers’ compensation insurance premiums (typically $2.50–$5.50 per $100 of payroll for manufacturing), health benefits averaging $7,000–$12,000 per year per employee, and paid time off — and the true loaded cost of a single production operator runs $35,000–$52,000 per year in most US and Western European markets. In Southeast Asian markets, absolute wage costs are lower, but the throughput ceiling is identical regardless of labor market.
How many operators does a manual line actually need?
A realistic manual tube filling station requires more hands than the filling step alone:
| Operator Role | Fonction | Headcount (per shift) |
|---|---|---|
| Tube loader | Positions empty tubes at fill station | 1–2 |
| Filler/sealer | Operates filling equipment, seals tube tail | 1–2 |
| Quality inspector | Checks fill weight, seal integrity, appearance | 1 |
| Rework handler | Corrects underfilled, leaking, or crooked tubes | 0.5–1 |
| Packing operator | Collates, boxes, and labels finished tubes | 1 |
| Total per shift | 4.5–7 operators |
At a mid-range loaded cost of $40,000 per year per operator, a six-person manual filling team costs $240,000 per year — before a single minute of overtime.
Shift Scheduling and Overtime Burdens
Manual filling lines are paced by human output. When order volumes increase, the only lever available is more time — and that time comes at a premium.
In the United States, overtime must be paid at 1.5× the regular rate for hours beyond 40 per week under the Fair Labor Standards Act. A manufacturer running consistent weekend overtime across four operators spends an additional $18,000–$32,000 per year purely on the overtime premium — money that generates zero additional production capacity beyond what those same operators could produce at regular pace.
Worse, sustained overtime degrades the output quality it’s supposed to increase. Studies on manual packaging operations document a 12–18% increase in defect rates during the final two hours of overtime shifts — meaning the tubes you’re paying a premium to produce are statistically the most likely to be rejected.
Training and Skill Retention Challenges
Manual tube filling has a deceptively high training cost relative to its apparent simplicity.
A new tube filling operator requires 2 à 4 semaines to reach consistent production rate and acceptable defect levels. In pharmaceutical environments with strict contamination protocols and documentation requirements, that timeline extends to 6–8 weeks before an operator is qualified to work unsupervised.
The US manufacturing sector’s annual voluntary turnover rate consistently runs at 25–35% for production floor roles. For a six-person filling team, that means recruiting and retraining 1.5–2 new operators per year at a documented average replacement cost of $4,000–$7,000 per production worker (recruitment, pre-employment screening, HR administration, and productivity loss during onboarding). That’s a recurring annual cost of $6,000–$14,000 that rarely appears in any cost-per-tube calculation.
Workplace Safety and Compliance Costs
Manual tube filling creates repetitive strain exposure that most manufacturers underestimate until an injury claim arrives.
Manufacturers pay an average of $29,100 per employee annually to comply with federal safety regulations — nearly double the $12,800 per employee average across all industries, according to the Manufacturing Dive. Workers’ compensation claims involving musculoskeletal disorders from repetitive tube handling average $28,000–$42,000 per claim in direct and indirect costs (medical treatment, lost productivity, temporary labor, administrative burden).
Beyond direct injury costs, facilities with elevated injury rates face OSHA inspection risk and insurance premium increases at annual renewal — increases that are difficult to quantify in advance but consistent in their direction.
2. Product Waste and Material Loss in Manual Filling Systems
Spillage and Overfilling Problems
Ask a manual filling operator why they consistently fill slightly above target weight and you’ll hear the same answer: “It’s safer than underfilling.” That instinct is rational — but it’s costing you money with every tube.
Industry data from pharmaceutical and cosmetic manufacturers documents that manual filling operations overfill by 2–8% on average to remain within minimum fill requirements. Most filling lines are quietly leaking profit into every tube they produce.
To make this concrete: a manufacturer filling 100g cosmetic tubes at a 5% average overfill rate gives away 5g of product per tube free of charge. At a product cost of $18/kg and a monthly output of 500,000 tubes, that represents $45,000 in monthly product giveaway — or $540,000 per year — before a single tube is returned, rejected, or recalled.
Underfilling Issues and Customer Returns
The inverse problem is equally costly. Manual filling accuracy in sustained production sits at ±3–5% compared to ±0,5–1,01 TP3T achievable with servo-driven automatic systems. When operators are fatigued late in a shift, filling variance widens further.
Underfilled tubes that reach retail customers generate complaints, returns, and negative reviews — all of which carry costs that extend well beyond the replacement tube. A cosmetic brand that manages just 200 customer complaints per month attributable to fill inconsistency spends an estimated $12,000–$25,000 per year in customer service labor, shipping costs, and replacement product — before accounting for the long-term brand perception damage that erodes repeat purchase rates.
Contamination and Quality Rejection Rates
Manual tube handling introduces contamination pathways that automatic systems eliminate by design. Every time an operator’s gloved hand contacts a tube interior, cap seating surface, or nozzle, a contamination opportunity is created.
Typical manual production rejection rates for cosmetic tube operations run at 1.5–3.0% of output, compared to 0.1–0.5% on well-maintained automatic lines. At 500,000 tubes per month and a product-plus-tube cost of $0.60 per unit, a 2.5% rejection rate generates $7,500 in monthly scrap losses — $90,000 annually — from defects that automation largely eliminates.
In pharmaceutical production, batch rejections are categorically more expensive. A rejected pharmaceutical batch triggers mandatory root-cause investigation, CAPA (Corrective and Preventive Action) documentation, potential regulatory reporting, and destruction of the entire affected quantity — costs that regularly reach $50,000–$200,000 per incident depending on batch size and active ingredient value.
Ingredient Degradation During Extended Manual Processes
Manual filling lines operate slowly. That slow pace is not merely an efficiency problem — it is a product stability problem.
Formulations containing oxidation-sensitive actives (retinol, vitamin C, benzoyl peroxide, certain essential oils) have a documented time-in-air exposure window beyond which degradation is measurable. A manual filling cycle that takes 4–6 hours to process a batch keeps product in an open transfer vessel far longer than the 45–90 minutes of the equivalent automatic line cycle.
A personal care brand manufacturing a 0.3% retinol night cream documented a 22% increase in retinol degradation between batch start and end-of-batch fill when operating under their manual process — a degradation gap large enough to create inconsistency in product potency across the same labeled batch.
3. Quality Inconsistencies That Impact Your Bottom Line
Fill Weight Variation and Regulatory Compliance
In pharmaceutical tube filling, fill weight consistency is not a quality preference — it is a regulatory mandate. EU pharmacopeia standards require fill volume accuracy within ±3% for pharmaceutical tube products. Many major cosmetic retail buyers now contractually require ±2% or better as a supplier qualification criterion.
Manual operations typically produce fill weight Cpk values of 0.9–1.2. (Cpk, or Process Capability Index, measures how well your fill weights stay within specification limits; pharmaceutical standards typically require Cpk ≥ 1.33.) A Cpk of 1.0 means approximately 0.27% of your output statistically falls outside specification — at 10 million tubes per year, that’s 27,000 non-conforming units available to generate complaints, returns, or regulatory action.
Glossary: Cpk (Process Capability Index) A statistical measure of how consistently a process produces output within specification limits. A Cpk of 1.33 means the process is producing within specifications with a very low defect probability. Manual filling typically achieves Cpk 0.9–1.2; automatic servo-driven systems achieve Cpk 1.5–2.0.
Example: A pharmaceutical ointment tube must contain 50g ± 1.5g. A manual line with Cpk 1.0 will statistically produce approximately 2,700 out-of-spec tubes per million. An automatic line with Cpk 1.67 will produce approximately 60 per million.
Seal Integrity Problems and Product Integrity
Manual tube sealing produces inconsistent tail geometry. Sealing jaw temperature variations, inconsistent tube positioning by the operator, and variable dwell time all contribute to seals that meet the minimum acceptance threshold on inspection — but fail in distribution under the thermal cycling and mechanical stress of real logistics.
A leaking tube that reaches a retailer’s shelf generates the worst possible customer experience: visible product contamination inside the package. Beyond the single lost sale, that experience creates brand abandonment rates of 38–52% for the affected SKU among customers who encounter it, per consumer behavior research in the personal care category.
Aesthetic Defects and Brand Perception
Tube appearance is brand equity made tangible. Crooked seals, inconsistent seal widths, uneven tail edges, and color registration drift on decorated tubes are all directly attributable to manual process variability — and all directly visible to the end customer at the moment of purchase decision.
Research consistently documents that 73% of purchase decisions for personal care products are influenced by packaging aesthetics at point of sale. A tube that looks slightly off-center or shows an irregular seal communicates manufacturing inconsistency regardless of whether the formula inside is identical to a perfectly finished competitor.
For wholesale accounts — particularly specialty retailers, pharmacies, and luxury distributors — aesthetic inconsistency is sufficient grounds for order cancellation. The revenue cost of a lost wholesale account is not the value of one order; it is the value of all future orders from that account.
Batch Traceability and Documentation Gaps
Manual operations create documentation that is retrospective, operator-dependent, and inherently incomplete. Batch records compiled by hand after production are subject to transcription error, missing data points, and the human tendency to record what should have happened rather than what did.
FDA and EU GMP regulations require complete, contemporaneous batch record documentation — meaning records created at the time of production, not reconstructed afterward. During an FDA inspection, a documentation gap in a batch record is not a minor administrative finding. It is, in the FDA’s own guidance language, evidence of a “failure of the quality system” — a finding that can trigger Warning Letters, consent decrees, and in severe cases, facility shutdown.
4. Production Capacity Limitations and Lost Revenue Opportunities
Throughput Constraints in Manual Operations
Manual tube filling produces between 300 and 500 tubes per hour under realistic sustained conditions — including minor stops, operator breaks, quality checks, and the natural pace variation that occurs across an 8-hour shift.
Compare this directly to automated alternatives:
| Type de système | Realistic Throughput | Tubes per 8-Hour Shift | Annual Capacity (250 days, 2 shifts) |
|---|---|---|---|
| Manual filling | 300–500/hr | 2,400–4,000 | 1.2M–2.0M |
| Semi-automatic (trained operator) | 1,200–1,800/hr | 9,600–14,400 | 4.8M–7.2M |
| Automatic (single-head, 80 TPM) | 4,320–4,800/hr | 34,560–38,400 | 17.3M–19.2M |
| Automatic (dual-head, 120 TPM) | 6,480–7,200/hr | 51,840–57,600 | 25.9M–28.8M |
TPM = Tubes Per Minute. Automatic figures assume 90% OEE (Overall Equipment Effectiveness — a measure of how much of your scheduled production time is truly productive). Source: industry production data and Miyoda Packaging Machinery technical specifications.
Inability to Scale Without Proportional Labor Increases
The fundamental economic problem with manual tube filling is that every increment of output requires a proportional increment of labor. There is no leverage.
A manufacturer who needs to double output from 2 million to 4 million tubes per year on a manual line must roughly double their operator headcount — adding $160,000–$240,000 in annual labor cost to achieve revenue growth that a single automatic machine could deliver with one additional technician.
This scaling math compounds over time. At 5 million tubes per year, the annual labor cost of maintaining a manual operation is typically $180,000–$280,000 more than the equivalent automatic line — a differential that exceeds the purchase price of many entry-level automatic machines within 18–24 months.
Missed Market Opportunities and Competitive Disadvantage
Capacity constraints translate directly into missed revenue. A cosmetic contract manufacturer in Southeast Asia operating on manual filling lines declined a private-label retail contract for 800,000 units per month because their line couldn’t guarantee the volume on the requested timeline. The contract went to a competitor with automatic filling capacity.
The immediate cost was a lost contract. The compounding cost was the reputational signal: brands and distributors that receive a “can’t deliver” response rarely return to the same supplier when they next scale.
Extended Lead Times and Working Capital Drain
Manual production requires longer production runs to amortize the setup and changeover time across adequate output. Longer production runs mean more finished goods inventory sitting in your warehouse waiting to be shipped.
Excess finished goods inventory is not a neutral condition — it’s working capital tied up and unavailable for marketing, formulation development, or capacity investment. A manufacturer holding 6 weeks of finished goods inventory instead of 2 weeks (because manual production prevents responsive make-to-order scheduling) has capital locked in product that is simultaneously aging, occupying storage space, and not earning return.
5. Equipment Maintenance and Operational Downtime Costs
Manual Equipment Wear and Frequent Repairs
Basic manual tube filling equipment — hand-operated piston fillers, benchtop heat sealers, manually adjusted sealing jaws — fails more frequently than manufacturers expect, because the failure mode is not mechanical design failure. It is abuse through inconsistent operation.
Operators who adjust filling volume by “feel,” who use excessive force closing sealing jaws, and who operate equipment outside its documented parameters create accelerated wear that no preventive maintenance schedule can fully offset. Piston seals that should last 6 months under documented operating conditions fail in 3–4 months under typical manual operation conditions.
Production Stoppage During Equipment Failures
When a manually operated filling station goes down, the entire production run stops. There is no automatic system to reroute output, no buffer inventory built into the line, and no PLC alarm to flag the problem before it creates a cascade.
Lost production hours on a manual line running at 400 tubes/hour cost approximately $240–$400 per hour in direct output value (at a conservative $0.60–$1.00 per finished tube). A 4-hour unplanned stoppage generates $960–$1,600 in lost output plus any penalty fees for missed customer delivery commitments, which in contract manufacturing commonly run 1–2% of order value per day delayed.
Lack of Preventive Maintenance in Manual Systems
Automatic tube filling machines from manufacturers like Miyoda Packaging Machinery are designed with predictive maintenance capability — sensors that monitor fill weight drift, sealing jaw temperature variance, and conveyor load can flag component degradation before it causes production failure.
Manual equipment has no equivalent. The only maintenance signal is failure. Emergency repair costs for manual equipment — sourcing parts, waiting for a technician, and compensating for lost production — typically run 3–5× the cost of planned preventive maintenance for the same components.
Operator Error and Equipment Damage
Human error damages filling equipment faster than any other variable. Incorrect nozzle installation, improper cleaning that introduces moisture into electrical components, and accidental collisions between product containers and sealing jaws all contribute to accelerated wear that most manufacturers attribute to “equipment age” rather than operational practice.
Replacement cycle acceleration is the hidden capital cost: manual filling equipment that should last 8–10 years with proper use is frequently replaced in 4–6 years under real operating conditions.
6. Energy and Facility Costs for Extended Manual Operations
Labor Hours Extended to Meet Production Targets
Manual lines can’t produce more per hour — only more hours. That means meeting production targets requires extending facility operating time: later shifts, additional weekend running, and in peak season, 24-hour operations with all the utility cost that implies.
HVAC, lighting, and compressed air across an extended 12-hour shift versus an 8-hour shift adds 18–25% to your per-tube facility overhead cost — an increase that is invisible in standard manufacturing cost models but very visible in your electricity bill.
Inefficient Space Utilization in Manual Setups
Manual tube filling requires significantly more floor space per unit of output than automated alternatives. A complete manual filling station — operator workspace, tube staging area, filling equipment, sealing bench, quality inspection table, and rework zone — occupies approximately 25–40 square meters per 400 tubes/hour of output.
A mid-range automatic tube filling machine occupies 15–25 square meters while producing 4,800–7,200 tubes/hour — a 12–18× improvement in output per square meter of facility floor space.
In manufacturing markets where industrial real estate runs $8–$25 per square foot per year, this floor space differential represents a meaningful ongoing cost advantage for automation.
Facility Expansion Costs to Accommodate Manual Growth
Scaling a manual operation requires scaling physical space. A manufacturer doubling output from 2 million to 4 million tubes per year on manual lines needs roughly double the floor space, double the utilities capacity, and potentially double the cleanroom volume — capital investments running into the hundreds of thousands of dollars that a single automatic machine upgrade would render unnecessary.
7. Regulatory Compliance and Risk Management Expenses

Regulatory compliance documentation in pharmaceutical tube filling: manual processes create documentation gaps that cost millions to remediate.
FDA and Pharmaceutical Compliance Documentation
The cost of maintaining manual process documentation for FDA inspection readiness is significantly higher than most manufacturers budget for — because it requires dedicated personnel whose entire role is creating, organizing, and cross-referencing the paper trail that automated systems generate automatically.
A pharmaceutical manufacturer operating a manual filling line requires at minimum one dedicated quality documentation specialist whose primary function is creating, maintaining, and filing batch records, deviation reports, and process logs that an electronic batch record system on an automatic machine generates with zero incremental labor. At fully loaded costs of $65,000–$95,000 per year, that documentation specialist is one of the most expensive hidden costs in manual pharmaceutical tube filling.
The consequence of documentation failure is concrete and documented. A single FDA warning letter citing documentation inadequacies triggers a corrective action plan that costs $150,000–$500,000 in consulting fees, remediation activities, and the production disruption required to implement corrective controls — before any product recall costs are calculated.
According to data on Miyoda’s tube packaging compliance checklist for pharma and cosmetics, a single warning letter that leads to a batch recall costs an average mid-size pharmaceutical company between $2 million and $10 million.
EU GMP Requirements and Validation Challenges
ISO 22716 for cosmetics and EU GMP Annex 15 for pharmaceuticals both require equipment validation documentation that manual systems cannot generate electronically. The validation cost for manual pharmaceutical equipment — writing and executing Installation Qualification (IQ), Operational Qualification (OQ), and Performance Qualification (PQ) protocols on equipment that has no built-in data logging — is paradoxically higher than for automatic systems, because every parameter must be manually documented, witnessed, and signed.
Glossary: IQ / OQ / PQ The three-stage qualification protocol required for pharmaceutical production equipment.
- IQ (Installation Qualification): Verifies the machine was installed correctly with the right utilities and environment.
- OQ (Operational Qualification): Confirms it performs within specification across its operating range.
- PQ (Performance Qualification): Demonstrates it consistently produces compliant product across three consecutive production batches under real conditions.
Cost range: $20,000–$100,000 depending on equipment complexity and market. Timeline: 8–16 weeks after installation.
Audit and Inspection Preparation Costs
A pharmaceutical or cosmetic facility scheduled for a regulatory inspection realistically spends 3–6 weeks of management and quality staff time preparing documentation, conducting internal pre-audits, and remedying identified gaps. For a manual operation with incomplete or inconsistent records, that preparation period extends — and the remediation activities discovered during preparation are typically more extensive than those of a well-documented automatic line.
The cost of this preparation is not just the hours spent. It is the production time those same managers and quality staff are not spending on operating the business.
8. Hidden Administrative and Overhead Burdens
Payroll Processing and HR Management
Managing a team of 5–8 manual filling operators creates administrative complexity that scales with headcount. Payroll processing, benefits administration, performance management, scheduling, and HR compliance each require time and system investment proportional to the number of employees managed.
Benefits administration alone for a 6-person filling team — managing health insurance enrollment, tracking FMLA leave, documenting disciplinary records, processing 401(k) contributions — consumes an estimated 80–120 hours per year of HR staff time, at a fully loaded cost of $5,000–$9,000 annually for that administrative function alone.
Inventory Management Complexity
Manual filling operations require more finished goods inventory buffer because output rate and quality cannot be reliably predicted in advance. A manual line that produces 380 tubes per hour on Monday may produce 310 on Friday — a 19% variance that forces inventory managers to maintain safety stock large enough to cover the worst-case production scenario.
That additional safety stock inventory represents tied-up working capital et increased warehousing cost — typically 20–30% of inventory value per year when carrying costs (capital, storage, insurance, handling) are fully accounted for.
Quality Control and Testing Resources
Manual filling’s inherent variability requires more quality control intervention to catch problems before they ship. Where an automatic line with in-line checkweighers flags out-of-tolerance fills in real time, a manual line depends on end-of-batch sampling that can miss systematic drift accumulated across an entire production run.
This means larger QC sampling sizes (typically 2–3× the sample size required for automatic production), more frequent testing intervals, and higher QC staff headcount per unit of output — all adding directly to the cost per tube produced.
9. Comparative ROI: Manual vs. Automatic Tube Filling Systems
Total Cost of Ownership Calculation
The purchase price of tube filling equipment represents 30–40% of its total cost of ownership over a 5–10 year service life. The following model uses a 5-year horizon for a manufacturer producing 5 million tubes per year:
| Cost Component | Manual/Semi-Auto Line | Automatic Line | 5-Year Delta |
|---|---|---|---|
| Equipment purchase | $25,000–$50,000 | $80,000–$120,000 | –$55,000–$95,000 |
| Annual labor (fully loaded) | $220,000–$280,000 | $55,000–$80,000 | +$825,000–$1,000,000 |
| Annual product waste (2.5% at $0.60/tube) | $75,000 | $15,000 | +$300,000 |
| Annual QC/compliance overhead | $60,000–$90,000 | $25,000–$40,000 | +$175,000–$250,000 |
| Annual maintenance & repairs | $12,000–$25,000 | $15,000–$25,000 | –$15,000–$0 |
| 5-Year Total Cost | $1,340,000–$1,820,000 | $440,000–$640,000 | $700,000–$1,180,000 savings |
Assumptions: 5M tubes/year, $0.60/tube blended product+tube cost, US market labor rates. Automatic line capex $100,000, ancillary costs $30,000.
Labor Cost Reduction in Automatic Operations
A fully automatic tube filling machine operates with 1 technician monitoring multiple lines, compared to 4–7 operators required for equivalent manual output. At a blended US labor rate of $40,000 fully loaded, the annual labor saving from eliminating 5 operators is $200,000 per year.
That $200,000 annual saving against a $130,000 total machine investment (equipment + installation + training) produces a straightforward payback period of under 8 months from labor savings alone — before a single dollar of waste reduction, compliance cost avoidance, or revenue growth from higher capacity is included.
Waste Reduction and Material Savings
The fill accuracy improvement from manual to automatic is measurable and direct. Moving from manual (±3–5% variance) to servo-driven automatic (±0.5%) on a line producing 500,000 tubes per month of 50g product at $18/kg cost:
$$\text{Annual Manual Waste} = 500{,}000 \times 12 \times 50\text{g} \times 3% \times \frac{$18}{1{,}000\text{g}} = $162{,}000$$
$$\text{Annual Automatic Waste} = 500{,}000 \times 12 \times 50\text{g} \times 0.5% \times \frac{$18}{1{,}000\text{g}} = $27{,}000$$
$$\text{Annual Material Saving} = $162{,}000 – $27{,}000 = $135{,}000$$
That $135,000 annual material saving is pure margin recovery — product that was previously being given away free with every tube, now staying in your revenue.
Quality Improvement and Reduced Returns
Automatic systems reduce fill weight Cpk from 0.9–1.2 (manual) to 1.5–2.0. The practical outcome: a pharmaceutical manufacturer who switched from semi-automatic to a rotary automatic line reduced fill weight variance rejections from 1.8% to 0.18% — recovering approximately 900 kg of product waste per month. At $15/kg product cost, that is $162,000 per year in recovered margin from defect reduction alone.
Capacity and Revenue Growth Potential
The most underquantified benefit of automation is revenue that was never earned because capacity wasn’t there to earn it.
A single automatic line at 80 TPM produces 17–19 million tubes per year on two shifts. The same output on manual lines requires 8–10 operators per shift, multiple stations, and almost certainly expanded facility space. The revenue-generating capacity difference — accessible from a single machine investment — is the lever that turns automation from a cost-saving exercise into a growth strategy.
10. Making Your Investment Decision: A Practical Framework
Assessing Your Current Manual Operation Costs
Before evaluating any machine, calculate your true current cost per tube. Use this framework:
Step 1 — Labor cost per tube:
$$\text{Labor Cost/Tube} = \frac{\text{Total Annual Labor (fully loaded)}}{\text{Annual Tubes Produced}}$$
Step 2 — Waste cost per tube:
$$\text{Waste Cost/Tube} = \text{Avg Overfill%} \times \text{Product Cost/g} \times \text{Fill Weight (g)}$$
Step 3 — Quality/compliance cost per tube: Divide your annual QC staff costs, rework hours, reject material, and compliance overhead by annual output.
Step 4 — Sum all four components (material + labor + waste + compliance) for your true cost per tube. Compare this against the total cost of ownership of an automatic system per tube at your projected volume.
Most manufacturers who complete this exercise discover their true manual cost per tube is 2–4× higher than their quoted tube-plus-fill cost — because the quoted cost only captures materials, not the process overhead consuming the margin.

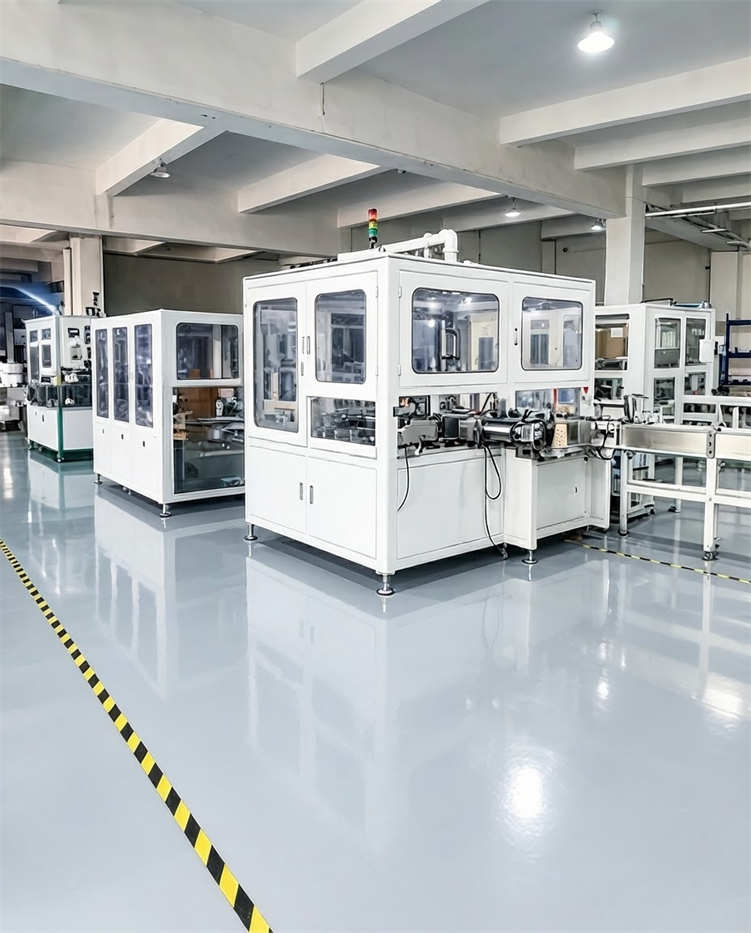
Automatic tube filling: the throughput, accuracy, and compliance documentation capability that manual operations cannot match at scale.
Evaluating Automatic System Options for Your Specific Needs
Matching machine to production requirement requires three inputs: your tube format (material, diameter, fill volume), your product type (viscosity determines pump type — piston for creams and gels, peristaltic for shear-sensitive formulations), and your regulatory environment (pharmaceutical GMP, ISO 22716 cosmetics, or standard commercial).
A fully automatic tube filling machine from Miyoda Packaging Machinery handles plastic (PE/PP/HDPE), laminate (ABL/PBL), and aluminum tubes across diameter ranges of 13–60mm and fill volumes from 5ml to 400ml — covering the full commercial range for cosmetic and pharmaceutical tube production. The machine’s servo-driven piston fill system achieves ±0.5% fill accuracy with Cpk values of 1.5–2.0 in sustained pharmaceutical production.
For manufacturers evaluating the full decision framework between automatic and semi-automatic configurations, Miyoda’s detailed comparison guide provides production data, 3-year TCO models, and application-specific guidance built around documented client production scenarios.
Financial Modeling and Break-Even Analysis
The payback period formula is straightforward:
$$\text{Payback Period (months)} = \frac{\text{Total Investment} \times 12}{\text{Annual Savings + Annual Revenue Gain}}$$
For a manufacturer investing $130,000 total (machine + installation + training) and saving $235,000 per year (labor $200,000 + waste reduction $35,000):
$$\text{Payback Period} = \frac{$130{,}000 \times 12}{$235{,}000} \approx 6.6 \text{ months}$$
At volumes above 5 million tubes per year, payback periods of 12–24 months are typical for well-specified automatic systems — after which every additional year of operation generates pure financial benefit.
Financing options: Equipment leasing allows manufacturers to access automatic filling capacity without full capital outlay, with monthly payments structured against production savings. For a $100,000 machine on a 48-month lease at 8% interest, monthly payments approximate $2,440 — comfortably covered by the $16,000–$18,000 per month labor saving from eliminating four manual operators. Financing providers specializing in manufacturing equipment, including Crest Capital’s packaging equipment financing program, offer terms structured specifically for this investment profile.
Implementation Planning and Transition Strategy
The transition from manual to automatic tube filling does not require a production shutdown. A phased approach works for most manufacturers:
- Months 1–2: Complete machine specification, place purchase order, begin facility preparation (power supply, compressed air, floor space clearing)
- Months 3–5: Machine delivery, installation, and commissioning (standard automatic machines: 4–12 weeks from order to delivery; allow 2–4 weeks for on-site commissioning)
- Month 4–6: Parallel running — automatic machine ramping up alongside existing manual station; validate fill weights, seal integrity, and print registration against your specifications
- Month 6 onward: Full production transfer; manual station retained as backup for development batches or SKU changeovers
Suppliers who provide on-site commissioning training with structured qualification documentation — as Miyoda Packaging Machinery does across their global customer base — significantly reduce the risk of extended parallel running periods.
Measuring Success Post-Implementation
Track these metrics from day one of full automatic operation:
| KPI | Manual Baseline | Automatic Target | Measurement Frequency |
|---|---|---|---|
| Fill weight Cpk | 0.9–1.2 | ≥1.5 | Per batch |
| Rejection rate | 1.5–3.0% | <0.5% | Quotidien |
| Throughput (tubes/hr) | 300–500 | 3,600–7,200 | Per shift |
| Labor cost per 1,000 tubes | $8.00–$16.00 | $1.50–$4.00 | Mensuel |
| Waste % of product | 2–8% | <1% | Mensuel |
| Downtime % (unplanned) | 12–18% | <5% | Hebdomadaire |
| Compliance findings per audit | 3–8 | 0–1 | Per audit |
Watch: Automatic 2-Head Tube Filling & Sealing Machine in Operation
Before committing to a machine specification, watching a production-grade automatic filler at operating speed provides context that no specification sheet can convey — observe the continuous rotary cycle, servo-driven fill stations, automatic tube orientation, hot-air sealing, and in-line batch coding running simultaneously:
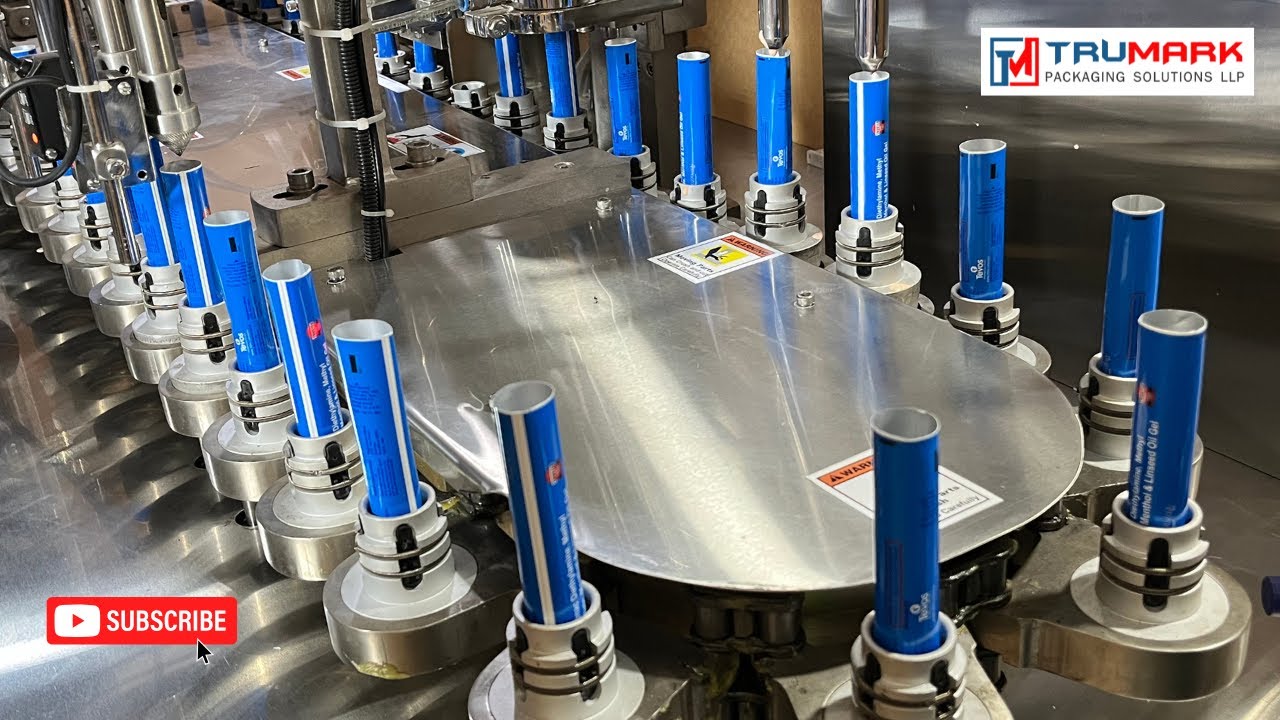
High-Speed Automatic 2-Head Tube Filling & Sealing Machine — observe the production speed, consistency, and zero manual tube-by-tube intervention that defines the economic case for automation.
The Real Cost of Staying Manual
The question facing every cosmetic and pharmaceutical tube manufacturer running manual or semi-automatic filling is not whether automation is expensive. It is whether the true cost of staying manual — labor, waste, quality failures, compliance exposure, and capacity constraints — is more expensive than the investment in automation.
The data in this guide provides a consistent answer across production scales: for manufacturers producing above 2–3 million tubes per year, manual operations are typically the more expensive choice once total cost of ownership is correctly calculated. The operators you’re paying to fill tubes manually are simultaneously creating the waste, variability, and documentation gaps that cost you orders, compliance margin, and brand reputation.
The most successful cosmetic and pharmaceutical tube packaging businesses don’t ask “Can we afford to automate?” They’ve already calculated their true manual cost and are asking “Which automatic system, from which supplier, on what implementation timeline?”
That is the right question. And it’s the one worth answering with real numbers, not assumptions.
Get Your Custom Tube Design Consultation
Connect with Miyoda Packaging Machinery’s engineering team. We’ll analyze your current production setup, calculate your true manual operation costs, and show you realistic ROI projections for your specific tube format, volume, and compliance requirements — no sales pitch, just production data.
 Total cost of ownership comparison: manual operations appear cheaper at equipment purchase, but automatic systems consistently deliver lower cost per tube at volumes above 2–3 million per year.
Glossaire des termes clés
| Term | Definition | Practical Example |
|---|---|---|
| Cpk (indice de capacité du processus) | Statistical measure of how consistently a process produces within specification limits | Manual filling: Cpk 0.9–1.2. Automatic: Cpk 1.5–2.0. Pharma requires ≥1.33 |
| OEE (efficacité globale des équipements) | Availability × Performance × Quality — measures productive use of scheduled time | World-class: 85–92%. Manual lines: 65–75%. Automatic lines: 82–92% |
| TPM (Tubes Per Minute) | Standard production rate metric for tube filling lines | Manual: ~5–8 TPM. Automatic single-head: 60–100 TPM |
| CAPA (Corrective and Preventive Action) | Documented process for identifying, investigating, and preventing quality failures | Required for every batch rejection in GMP pharmaceutical manufacturing |
| IQ/OQ/PQ | Installation / Operational / Performance Qualification — the three-stage equipment validation protocol | Required for pharmaceutical production; costs $20,000–$100,000; takes 8–16 weeks |
| cGMP | Current Good Manufacturing Practice — FDA’s minimum quality standards for pharmaceutical production | Non-compliance can result in Warning Letters, recalls, or facility shutdown |
| CIP (nettoyage en place) | Automated chemical flushing of product-contact surfaces without disassembly | Reduces changeover cleaning from 2–3 hours (manual teardown) to 30–45 minutes |
| Fill Weight Giveaway | Product volume filled above the target weight, representing product given away free | 3% overfill on 100g tubes at $18/kg = $0.054 per tube given away |
| Batch Rejection Cost | Total cost when an entire batch fails release criteria | Pharmaceutical batches: $50,000–$200,000 per rejected batch including investigation, CAPA, and destruction |
| ABL (stratifié à barrière d'aluminium) | Multi-layer tube material with aluminum foil inner layer providing near-zero oxygen transmission | Required for retinol, vitamin C, pharmaceutical ointments — incompatible with standard hot-air tube sealers |
Questions fréquemment posées
1. How much product waste is typical in manual tube filling operations?
Manual tube filling operations typically waste 2–8% of product through overfilling, spillage, and line losses — with most operators intentionally filling above target weight to avoid underfill complaints. Industry benchmark data documents overfill rates of 2–8% as standard in non-automated lines. To calculate your annual waste cost: multiply your monthly tube output by your average fill weight in kg, multiply by your overfill percentage, then multiply by your product cost per kg. A manufacturer filling 100,000 tubes/month of 100g product at $20/kg and 4% average overfill is giving away $96,000 in product per year. Automatic servo-driven systems reduce overfill to 0.3–0.5%, cutting this loss by 85–90%.
2. What is the average labor cost per tube produced with manual filling vs. automatic systems?
At US market labor rates (fully loaded at $40,000/year per operator), a manual line producing 2 million tubes per year with 6 operators carries a labor cost of $0.12 per tube. The same 2 million tubes on a semi-automatic line with 3 operators costs $0.06 per tube. An automatic line producing 8 million tubes per year with 1 technician costs $0.005 per tube — a 24× reduction in labor cost per unit. In Asian markets with lower absolute wages, the per-tube differential is smaller in absolute terms but the throughput and consistency advantages of automation are identical.
3. How do fill weight inconsistencies in manual operations affect regulatory compliance?
FDA cGMP regulations (21 CFR Part 211) and EU pharmacopeia standards require fill volume accuracy within ±3% for pharmaceutical tube products, with many buyers now contractually requiring ±2% or better. Manual operations consistently produce Cpk values of 0.9–1.2 — below the pharmaceutical standard of Cpk ≥1.33. Every batch produced outside specification is a potential regulatory finding, requiring investigation documentation, CAPA, and potential batch rejection. For cosmetics sold in the EU, ISO 22716 GMP compliance requires documented fill weight data that manual operations cannot generate automatically — creating an ongoing documentation burden and audit risk.
4. Can we continue manual filling while we grow, or do we need to automate now?
The economic threshold is approximately 2–3 million tubes per year in most markets. Below that volume, semi-automatic filling is typically the more rational capital allocation. Above 3 million tubes per year, the compounding cost of manual labor, waste, and quality management overhead typically exceeds the full investment cost of an entry-level automatic system within 18–24 months. The risk of waiting to automate until you’ve “clearly outgrown” manual capacity is that you lose the contracts and market opportunities that would have funded the automation investment — leaving you trying to justify the cost after revenue growth has already stalled.
5. What is the realistic ROI timeline for investing in automatic tube filling equipment?
For manufacturers above 5 million tubes per year, payback periods of 12–24 months are consistently achievable through labor savings and waste reduction alone — before compliance cost avoidance or revenue growth from higher capacity is included. For volumes of 2–5 million tubes per year, expect 18–36 months depending on your labor market, product margin, and degree of quality problems you’re currently absorbing. The Miyoda Packaging Machinery Buyer’s Guide provides a detailed payback calculator specific to cosmetic and pharmaceutical tube production scenarios.
6. How much floor space can we save by switching from manual to automatic tube filling?
A complete manual filling station (operator workspace, tube staging, sealing bench, QC inspection, rework zone) occupies approximately 25–40m² per 400 tubes/hour of output. A mid-range automatic tube filling machine occupies 15–25m² while producing 4,800–7,200 tubes/hour — a floor-space efficiency improvement of 12–18×. For manufacturers in markets where industrial real estate costs $15–$25 per square foot annually, a 30m² space recovery translates to $4,800–$8,000 per year in direct facility cost reduction.
7. Will automatic tube filling systems work with our existing cosmetic formulations?
Yes — the critical compatibility variable is product viscosity, not formulation type. Piston pump systems (the most common in cosmetic tube filling) handle creams, gels, ointments, and pastes across a viscosity range of 500–1,000,000 cP. Peristaltic pumps handle shear-sensitive formulations including certain gels and emulsions. Gravity-feed systems handle low-viscosity serums and toners below 500 cP. Before finalizing any automatic machine specification, run a Factory Acceptance Test (FAT) — a formal production trial at the vendor’s facility using your actual product and tube format — to verify fill accuracy and seal integrity before committing to delivery.
8. How do automatic systems reduce quality inconsistencies compared to manual filling?
The primary mechanism is removing operator variability from the process. A servo-driven automatic filling machine produces the same fill volume with the same pressure profile at tube #1 and tube #10,000,000 — human operators cannot. Specifically: automatic systems achieve Cpk 1.5–2.0 vs. 0.9–1.2 for manual, reducing out-of-specification output by 97–99%. In-line checkweighers detect and reject out-of-tolerance fills in real time rather than at end-of-batch sampling. Electronic batch records generate contemporaneous documentation that eliminates the transcription errors and data gaps that trigger regulatory findings on manual lines.
9. What happens to our employees if we automate manual tube filling operations?
The most successful transitions redeploy, rather than eliminate, manual filling operators. Production operators are typically retrained as machine technicians (learning PLC alarm diagnosis, changeover setup, and quality monitoring) or moved into quality control, logistics, or formulation support roles where human judgment adds more value than it does in repetitive filling tasks. Beyond being the ethical approach, retention of trained personnel during automation transitions dramatically reduces the knowledge loss and productivity disruption that comes with full workforce turnover. The net headcount reduction is real — but it typically comes through attrition, performance-based reassignment, and natural turnover management rather than large-scale layoffs.
10. How do automatic systems help us meet pharmaceutical packaging compliance requirements?
Automatic tube filling machines address pharmaceutical GMP compliance at three levels. First, equipment design: SS316L product-contact surfaces, Ra ≤0.8μm surface finish, no dead legs in product pathways, and CIP-capable architecture meet the material and cleanability standards of FDA 21 CFR Part 211 and EU GMP without requiring additional engineering controls. Second, process control: servo-driven fill systems with real-time weight monitoring and alarm functions provide the process capability documentation that regulatory inspectors require as evidence of process control. Third, data integrity: automatic batch record generation, parameter logging, operator ID tracking, and production data archiving satisfy the 21 CFR Part 11 electronic records requirements that FDA inspectors increasingly audit in pharmaceutical packaging operations.
11. What are the realistic production speed improvements we can expect with automation?
A single-head automatic tube filling machine at 80 TPM produces approximately 34,000–38,000 finished tubes per 8-hour shift at 90% OEE — compared to a manual operation’s 2,400–4,000 tubes per shift. That’s an 8–15× throughput improvement from the same facility footprint. For a manufacturer currently running two 8-hour manual shifts to produce 6,000 tubes per day, a single automatic machine running one 8-hour shift produces the same volume with approximately 80% less operator labor — freeing the facility to run a second shift of automatic production that generates entirely new revenue capacity.
12. How do we calculate the true cost of manual operations to justify equipment investment to stakeholders?
Use a four-component model: (1) Fully loaded annual labor cost — headcount × $35,000–$52,000 in US markets; (2) Annual product waste value — monthly tubes × fill weight × overfill% × product cost/kg × 12; (3) Annual compliance overhead — QC staff cost + documentation time + audit preparation + any penalty or rework costs from prior 12 months; (4) Lost revenue from capacity constraints — any orders declined, delayed, or outsourced at margin premium in prior 12 months. Sum these four components and divide by annual tube output for your true manual cost per tube. Present the 5-year cumulative cost against the total automatic system investment (machine + installation + training + validation) to demonstrate payback to financial decision-makers.
13. Are there financing or leasing options available for automatic tube filling equipment?
Yes — equipment leasing and financing are standard options for manufacturing capital equipment in the $60,000–$250,000 range. Specialized packaging equipment financing programs (such as Crest Capital et Providence Capital Funding) offer 24–72 month terms with monthly payments structured against equipment ROI. A $100,000 automatic tube filler on a 48-month lease at 8% interest generates monthly payments of approximately $2,440 — readily covered by the $16,000–$18,000/month labor savings from eliminating four manual operators. Operating lease structures can also provide tax advantages by keeping equipment off the balance sheet, depending on your jurisdiction and accounting framework.
14. How long does it take to implement and validate a new automatic tube filling system?
For standard cosmetic-grade automatic tube filling equipment: plan 16–24 weeks from purchase order to first commercial production. This breaks down as: 10–16 weeks machine lead time (manufacturing and testing), 2–4 weeks on-site installation and commissioning, 2–4 weeks parallel validation running alongside existing production. For pharmaceutical-grade installations requiring full IQ/OQ/PQ validation: add 8–16 weeks for validation protocol execution after commissioning — bringing the total to 24–40 weeks. Suppliers who provide IQ/OQ/PQ template protocols as standard scope (not a paid add-on) significantly reduce the protocol development time within this window.
15. What support and training do we receive after purchasing an automatic tube filling system?
Expect the following from a reputable supplier at minimum: on-site commissioning and operator training (typically 5–10 days included in the purchase scope), operating and maintenance manuals in your working language, spare parts recommendation list with 12-month initial inventory guidance, remote diagnostic support via video call and, increasingly, real-time PLC monitoring for suppliers with IIoT-connected machines. Miyoda Packaging Machinery provides video-based remote support programs specifically designed for clients in markets where locally available filling machine technicians are difficult to source — allowing operators to resolve most first-level issues without waiting for physical technician dispatch. Confirm support scope explicitly in your purchase agreement before signing.