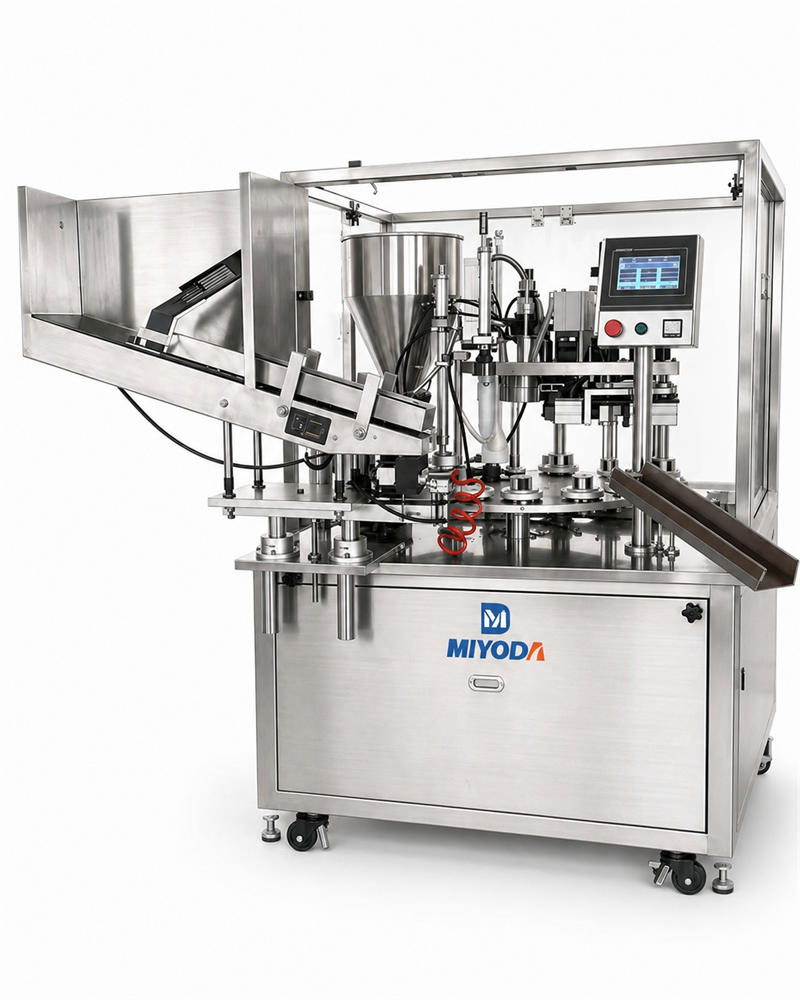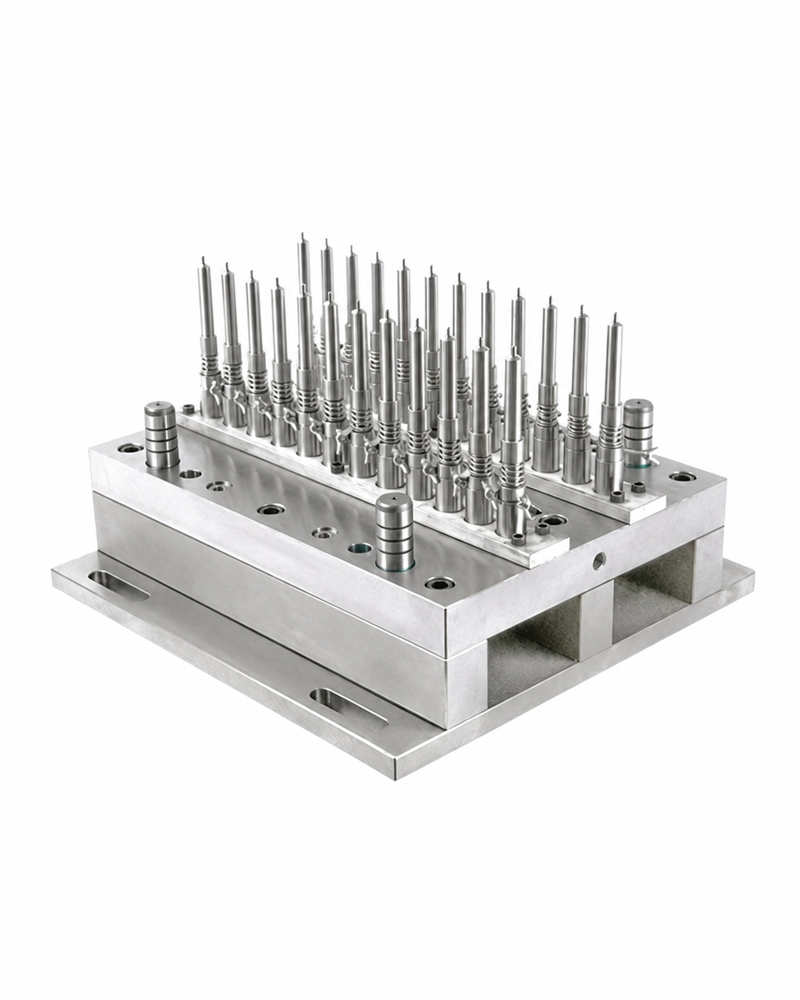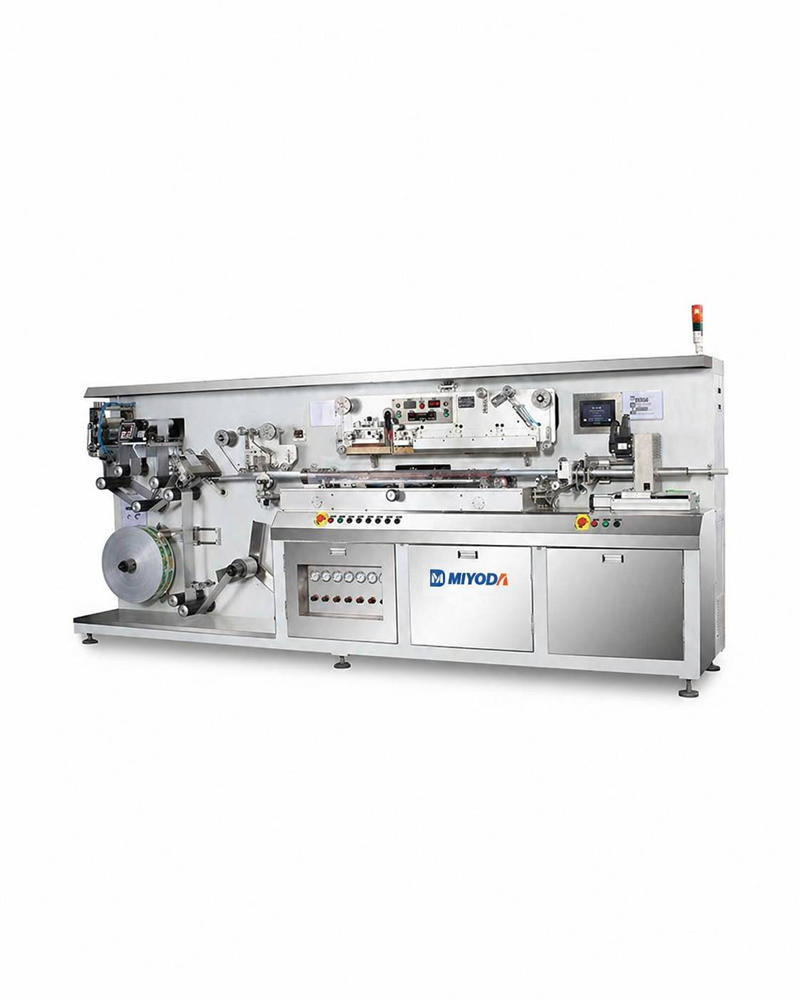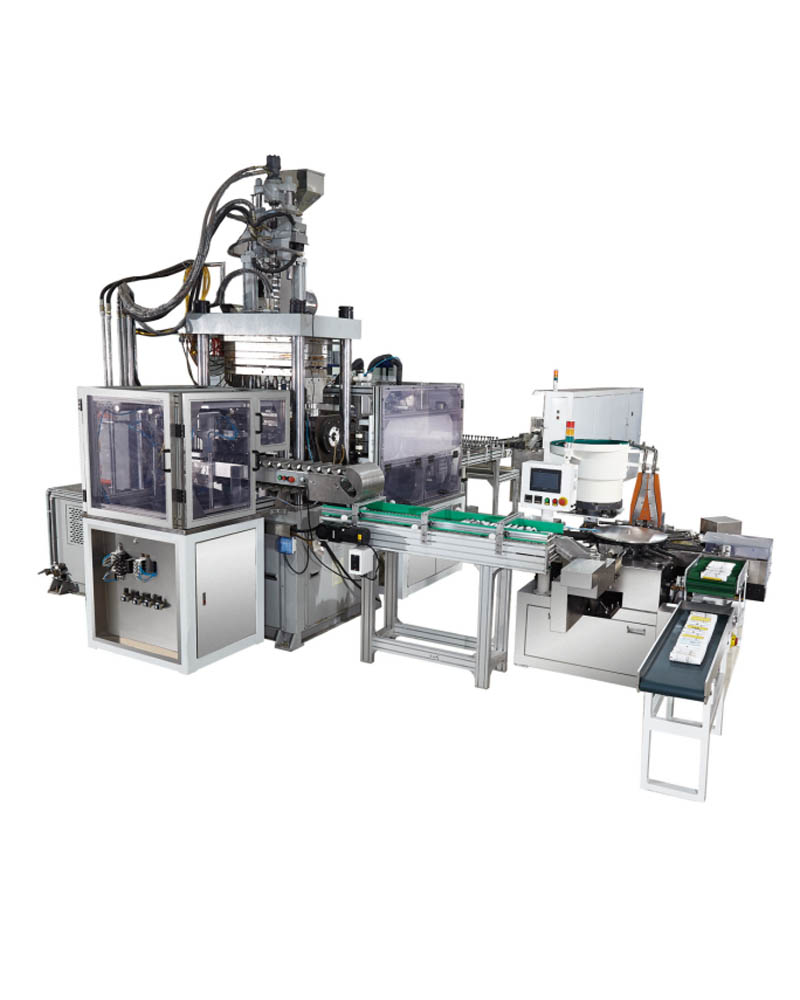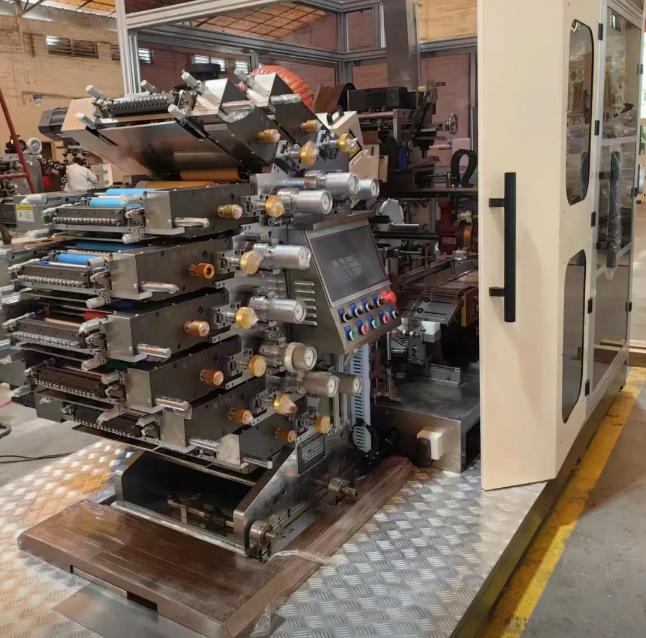
The cosmetic and pharmaceutical tube printing market does not reward intention. It rewards execution — and execution is specific. Every production facility has a different constraint, whether that is color inconsistency that’s losing retail buyers, setup times that make custom orders uneconomical, compliance documentation that blocks export contracts, or manual inspection that lets defective tubes reach the end customer.
The ten case studies in this guide document operations that faced exactly those constraints — and resolved them with specific, measurable actions. None of the results described here are projections or estimates. Each represents a documented operational outcome from a cosmetic or pharmaceutical tube printing operation that changed something concrete and measured what happened next.
If you manufacture tubes, distribute printing equipment, or source packaging on behalf of a cosmetic or pharmaceutical brand, the patterns across these ten cases apply directly to your situation. Read them as a decision tool, not a success story collection.

Case Study 1: How a Mid-Sized Cosmetics Brand Reduced Printing Defects by 67% in Six Months
The Challenge They Faced
A cosmetic tube manufacturer producing approximately 8 million tubes per year across 14 active SKUs was experiencing a defect rate of 3.8% — primarily color variation between batches and registration errors on multi-color designs. Their largest retail buyer had specified a Pantone color tolerance of ΔE ≤ 2.0 across all batches as a supplier qualification condition. The manufacturer was averaging ΔE 3.6 in practice.
The consequences were immediate: one in every 26 tubes was rejected at end-of-line, driving material waste costs of approximately USD 58,000 per year. Customer complaints about batch-to-batch color inconsistency had generated three formal supplier quality notifications from key accounts in 12 months. Delivery timelines were slipping because production had to be extended to compensate for scrap.
Key Term: ΔE (Delta E) — A numerical measure of color difference between two samples. ΔE 1.0 is invisible to the human eye. ΔE 2.0 is the standard cosmetic brand tolerance for Pantone-matched tubes. ΔE > 3.0 is visibly different on shelf and typically triggers rejection.
The Solution They Implemented
The operation did not replace their entire printing line. Instead, they made three targeted changes:
First, they implemented an inline spectrophotometric measurement system — a camera-based color measurement station positioned after each print station. This gave operators real-time ΔE data rather than relying on end-of-shift manual pull checks.
Second, they established a formal preventive maintenance schedule: calibration of ink train keys every 500 production hours, UV lamp intensity verification weekly, and mandrel wear inspection monthly. Before this program, maintenance was reactive — machines were serviced after failures, not before.
Third, they conducted a two-day structured training program for all press operators covering color density target ranges (SID — Solid Ink Density), ink viscosity management, and the correct response to an out-of-tolerance alert from the inline measurement system.
Key Term: SID (Solid Ink Density) — A densitometric measurement of ink coverage on a solid printed patch. Used for real-time color control. Standard offset targets: Black 1.65–1.75, Cyan 1.35–1.45, Magenta 1.45–1.55, Yellow 1.30–1.40. Deviation outside ±0.08 typically signals a color drift event requiring correction.
The Results They Achieved
Within six months of implementing all three changes:
- 67% reduction in printing defects — defect rate fell from 3.8% to 1.25%
- 40% decrease in material waste — annual scrap cost reduced from USD 58,000 to approximately USD 34,000
- ΔE performance improved to 1.8 average — passing the retail buyer’s ≤ 2.0 specification consistently
- ROI achieved within 8 months — total investment in the spectrophotometric system, training, and calibration tooling: USD 34,000; annual saving from waste reduction and avoided quality notification costs: USD 51,000
The retail buyer removed the supplier quality notification flag after two consecutive audit cycles with zero color-related rejections.
Key Takeaways for Your Operation
The lesson here is not about equipment cost — the total investment was USD 34,000, not a new printing line. The lesson is about measurement lag. This operation had been making decisions about color based on data that arrived 2–4 hours after the relevant production window had already passed. Inline measurement closed that lag to seconds.
If your current quality control depends on periodic manual pulls and end-of-shift reviews, calculate how many tubes you produce between each measurement event. That number represents your exposure window — the production volume that could be out of specification before you detect it. For most mid-volume operations, that window is 4,000–8,000 tubes per event. At a defect cost of even USD 0.12 per tube, a single undetected drift event costs USD 480–960 — before rework and schedule impact.
Case Study 2: Scaling Production Without Sacrificing Quality — A Pharmaceutical Manufacturer’s Success Story
The Challenge They Faced
A pharmaceutical contract manufacturer was running three offline tube filling lines producing approximately 2.4 million tubes per month. A new contract from a European pharmaceutical distributor required 6 million tubes per month — a 150% volume increase — with EU GMP Annex 1 compliant batch documentation for every production run.
Their existing printing equipment — older screen printing machines with manual ink key adjustment — had no batch record generation capability. Running at 150% of current volume on manual equipment would have required tripling their QC headcount and still risked failing the documentation audit that preceded the EU contract activation.
They had the contract. They had 14 weeks to deliver the first compliant batch.
The Solution They Implemented
The operation made a single large decision: replace two of the three existing screen printing lines with high-speed, GMP-ready printing equipment. Their specific requirements were pharmaceutical-grade batch record generation, multi-color capability across 12 SKUs with variable batch coding, and sustained throughput above 8,000 tubes per hour at 35mm diameter.
Simultaneously, they implemented standardized operating procedures (SOPs) for every printing-related process step: ink lot receipt, corona pre-treatment verification, in-process color measurement intervals, machine cleaning protocols, and batch record sign-off sequences. These SOPs aligned with EU GMP Annex 11 requirements for electronic batch records and data integrity.
Key Term: GMP (Good Manufacturing Practice) — Regulatory framework governing production quality, documentation, and equipment qualification for pharmaceutical and regulated cosmetic manufacturers. In the EU, pharmaceutical tube printing must comply with GMP Annex 1 (sterile products) or relevant guidelines. Batch records must be traceable to raw material lots, operator IDs, and machine settings.
The Results They Achieved
- 150% increase in monthly production capacity — from 2.4 million to 6 million tubes per month within 12 weeks of the first new line commissioning
- Zero compliance violations during the scaling period — the EU distributor’s pre-supply audit found all batch records complete and traceable
- 28% reduction in per-unit production cost — driven by higher machine throughput, reduced labor per thousand tubes, and elimination of manual batch recording errors requiring rework
- 12 new pharmaceutical clients engaged in the following 18 months — the compliant documentation capability became a commercial differentiator that the operation had not originally anticipated
Key Takeaways for Your Operation
Pharmaceutical tube printing compliance is not a documentation exercise bolted onto a production process. It is an equipment specification. If your printing machine’s control system cannot generate a GMP-compliant batch record natively, you are either producing records manually (with all the data integrity vulnerabilities that entails) or you are not producing them at all.
The cost of adding GMP-compliant control systems to a new machine at purchase is a fraction of the cost of retrofitting them after installation — and a fraction of the cost of a compliance failure that delays a contract activation. If you are currently serving or planning to serve pharmaceutical clients, confirm at the RFQ stage that the machine supplier can provide IQ/OQ (Installation Qualification / Operational Qualification) protocols and that the machine’s data logging is 21 CFR Part 11 compatible for US-bound products or equivalent for EU markets.
Case Study 3: Turning Customization Requests Into Profit — A Specialty Cosmetics Distributor’s Strategy
The Challenge They Faced
A specialty cosmetics distributor was receiving increasing requests from brand clients for custom tube printing: seasonal limited editions, event-specific promotional runs, regional market variants. The problem was not customer demand — it was production economics.
Each custom print job required 4 hours of setup time: plate mounting, ink train build-up, press proofing, and color approval before the first saleable tube came off the line. At a loaded machine cost of USD 95 per hour, that was USD 380 in setup cost before production began. On a 2,000-tube custom run, setup cost added USD 0.19 per tube to an already tight margin. Most custom jobs were priced below USD 0.15 per tube contribution — meaning setup costs alone pushed them below break-even.
The distributor was declining approximately 40% of incoming custom requests and losing those clients to competitors who could fulfill smaller, faster jobs.
The Solution They Implemented
The operation invested in printing equipment with documented quick-change capability — specifically, a platform with tool-free plate-locking, stored HMI (Human-Machine Interface) recipes per SKU, and automated ink train wash-up.
Key Term: HMI (Human-Machine Interface) — The touchscreen control panel through which operators interact with a printing machine. Modern HMI systems store complete machine parameter sets (recipes) for each SKU, so calling up a saved job means retrieving a stored file rather than manually re-entering parameters from a specification sheet — eliminating the most common source of setup error.
They also invested outside the machine: a digital asset management system for pre-approved artwork files (eliminating the prepress rework loop that added 1–2 days to each job) and structured cross-training so that three operators could perform setup independently rather than waiting for one specialist.
The Results They Achieved
- Setup time reduced from 4 hours to 45 minutes per custom job — a 81% reduction in non-productive machine time per changeover
- Custom order capacity increased by 200% — the same machine could now accept three custom jobs in the time it previously handled one
- 15% pricing premium achieved for custom runs — clients valued the turnaround time enough to pay for it
- 8 new distributor partnerships formed within 18 months — attracted by the ability to offer custom runs at lead times competitors could not match
The operation’s custom order revenue grew from approximately USD 280,000 to USD 640,000 annually in the 24 months following the equipment and workflow upgrade.
Key Takeaways for Your Operation
Setup time is a tax on every production run below your economic minimum batch size. If your current changeover takes 3–4 hours, calculate your break-even batch size at your loaded machine rate — that number is the wall below which you are declining or losing money on every order. Quick-change equipment lowers that wall, creating a profitable market segment from runs that were previously uneconomical.
The hidden parallel insight: cross-training matters as much as the machine. Quick-change tooling that only one operator can use correctly creates a single point of failure in your production schedule. The equipment investment and the training investment are both required.
Case Study 4: Solving Sustainability Challenges While Maintaining Print Quality
The Challenge They Faced
A mid-sized cosmetic tube manufacturer had received a formal supplier sustainability requirement from their largest retail buyer — a global beauty retailer implementing a supplier environmental scorecard as part of their 2025–2027 sustainability commitment. The requirement included documented transition to inks with VOC content below 5% by weight and proof of carbon footprint data per 1,000 tubes produced.
Key Term: VOC (Volatile Organic Compound) — Carbon-based chemicals that evaporate at room temperature. Present at 40–60% by weight in conventional solvent-based inks. Subject to regulatory emission limits under the EU Industrial Emissions Directive. Near-zero in water-based and UV-curable ink systems.
The manufacturer was running solvent-based screen printing inks on three production lines — a legacy choice that had never been formally reviewed. Their concern was straightforward: would switching to water-based or UV-curable inks produce tubes that passed the same adhesion, abrasion, and chemical resistance tests their clients required? And what would the transition cost?
The Solution They Implemented
They piloted two alternatives in parallel: water-based UV-hybrid inks (water-based carrier, UV cross-linking cure) and standard UV-curable inks on a converted LED-UV curing system. Both candidates were tested on actual production substrates — 35mm PE tubes and 40mm ABL laminate tubes — through a 30-day accelerated aging protocol at 40°C / 75% RH.
Both systems passed ASTM D3359 tape adhesion (5B rating) after 30-day aging. The UV-curable system outperformed on abrasion resistance. The water-based UV-hybrid system produced lower ΔE variation across the test run (ΔE average 1.4 vs. 1.9 for the standard UV system) — attributed to more stable viscosity behavior under the ambient temperature variation in their production environment.
They converted all three lines to the water-based UV-hybrid system over 8 weeks. They also added a precision ink metering system with closed-loop density control to the converted lines.
The Results They Achieved
- 45% reduction in environmental impact — VOC emissions from printing operations dropped from an estimated 4.2 tonnes per year to near-zero; documented in the annual supplier sustainability report submitted to the retail buyer
- 12% premium pricing achieved on tubes marketed with certified sustainable decoration — communicated on tube packaging as “printed with sustainable inks”
- 18% reduction in ink consumption costs — the precision metering system eliminated over-inking; ink cost per 1,000 tubes fell from USD 3.80 to USD 3.12
- Retail buyer scorecard score improved from 61/100 to 88/100 — bringing the manufacturer into the buyer’s “preferred supplier” tier for the following contract year
Key Takeaways for Your Operation
Sustainability is not a cost to be managed — it is a margin lever for operations that execute the transition well. The manufacturer in this case did not simply switch inks and hope for the best. They ran a formal pilot protocol, selected the system that performed better on color consistency (not just the one that was cheaper), and combined the ink change with a precision metering system that paid for itself through reduced ink consumption.
The retail buyer’s scorecard improvement was worth more than the sustainability messaging: it secured preferred supplier status, which translates to first-offer rights on new product launches and protection against competitor displacement during annual supplier reviews. Quantify that value before you decide whether the transition cost is justified.
📺 Watch: Automatic Screen Printing for Cosmetic Tubes — Full Production Run
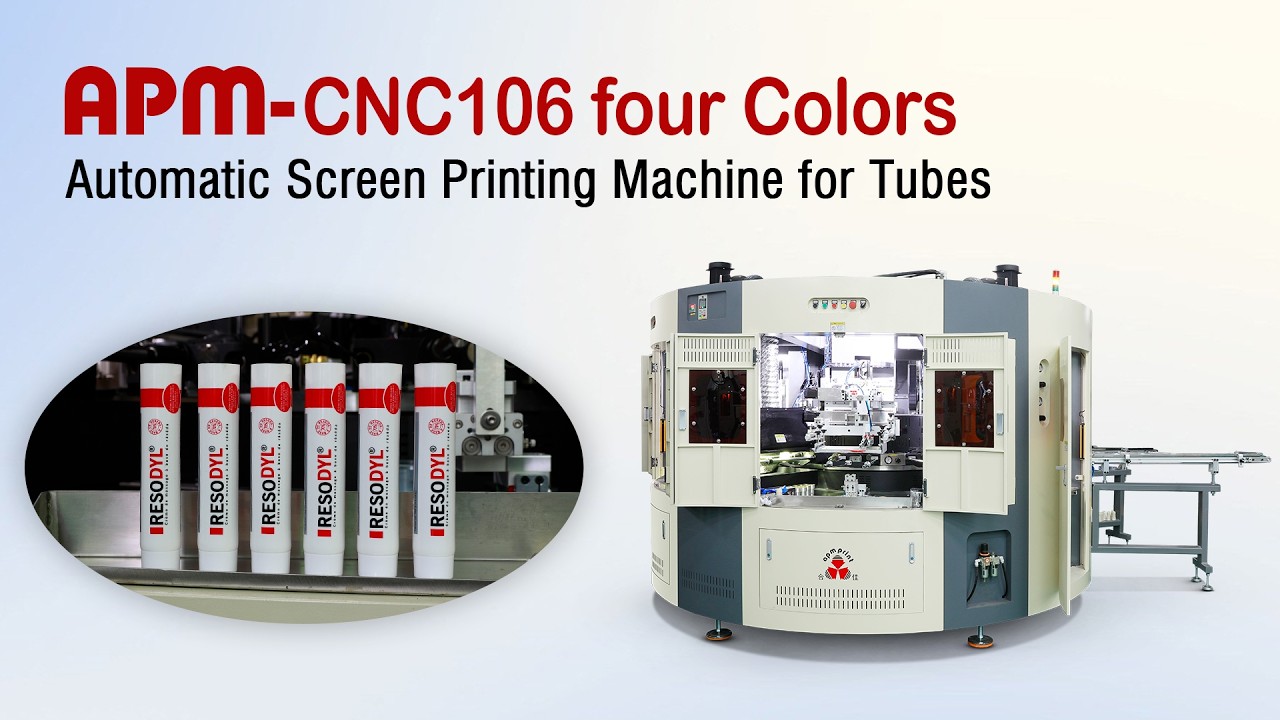
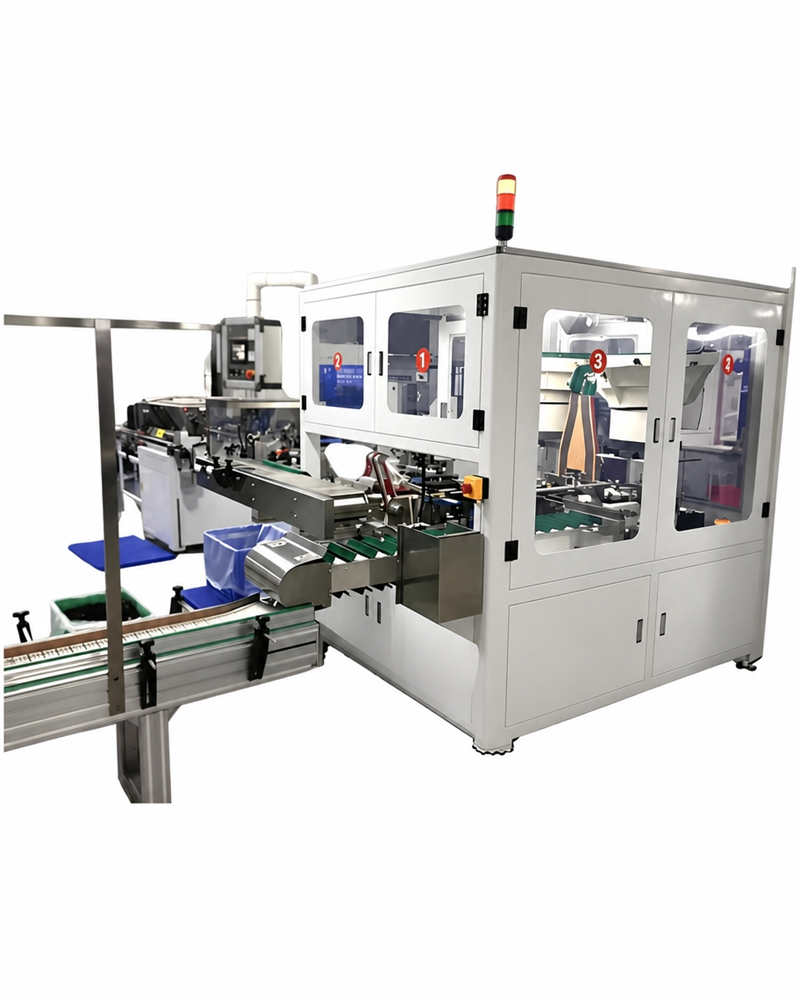
This video shows a high-speed automatic tube screen printing machine running multi-color decoration on cosmetic laminate tubes — including the indexing system, UV curing station, and output inspection. If Case Study 4’s water-based ink transition or Case Study 5’s automated inspection integration applies to your operation, pay attention to the inline process flow shown here.
Case Study 5: From Manual Quality Control to Automated Inspection — A Manufacturer’s Digital Transformation
The Challenge They Faced
A pharmaceutical tube contract manufacturer was relying on manual visual inspection at the end of each printing line — one inspector per line, examining tubes at a rate of approximately 1,200 per hour in a two-shift operation. Three documented issues had emerged over 18 months: two customer complaints from clients who received tubes with missing batch code characters (a pharmaceutical compliance failure), one minor recall of 22,000 tubes for a registration error that had not been caught at inspection, and a calculation showing that the end-of-line inspectors were missing approximately 13% of the defects they should have caught — based on a blind study that had split defective tubes into two equal groups, one inspected manually and one inspected under a reference vision system.
The manual inspection miss rate was not a training failure. It was a human physiological limit: at 1,200 tubes per hour across an 8-hour shift, inspector fatigue produced measurably higher miss rates in hours 5–8 versus hours 1–4.
The Solution They Implemented
The manufacturer integrated automated vision inspection systems into all four printing lines. Each system used a camera array capturing 360° tube surface images at production speed, comparing each image against an approved master template stored during the first production run approval.
Detection parameters were configured for: color deviation exceeding ΔE 2.0 on any surface zone; text legibility failures including missing characters, smeared text, and incorrect batch code characters; registration errors exceeding 0.15 mm; and substrate defects including scratches, contamination, and tube body dents that affected print adhesion.
Rejected tubes were automatically diverted to a separate collection container — removing them from the production flow without stopping the line. A digital quality dashboard displayed real-time defect type and frequency data, with alerts for any defect category exceeding its threshold in a rolling 200-tube window.
Key Term: OEE (Overall Equipment Effectiveness) — A composite manufacturing metric: OEE = Availability × Performance × Quality. For tube printing, the Quality component specifically captures the percentage of tubes produced that are within specification. Automated inspection improves the Quality component of OEE by detecting defects at line speed rather than batch-end review.
The Results They Achieved
- 99.2% defect detection rate compared to 87% for manual inspection — a 12.2 percentage point improvement in the Quality component of OEE
- 60% reduction in quality control time — one QC supervisor now covers four lines instead of one inspector per line
- Zero customer complaints related to printing defects in the 18 months following implementation — compared to 3 formal notifications and one recall in the prior 18 months
- 75% reduction in rework costs — defective tubes are now removed from the line at production speed; rework is reserved for mechanical stops only, not quality escapes
The avoided recall cost — conservatively estimated at USD 85,000 for the prior 22,000-tube event including logistics, documentation, and client relationship management — against a vision system investment of USD 48,000 across all four lines made the ROI calculation unambiguous.
Key Takeaways for Your Operation
Manual inspection is not a quality control strategy. It is a quality-sampling strategy with a documented average miss rate of 10–20% for subtle defects under production conditions. For cosmetic operations, a 13% miss rate on color defects may be acceptable. For pharmaceutical operations producing batch-coded tubes, a missed character error is a compliance event with recall exposure.
The question to ask is: what is your current documentation of your inspection system’s detection capability? If the answer is “we train inspectors well,” you have not measured your miss rate — you have assumed it is acceptable. The blind study methodology used in this case study (split a sample of known defective tubes between your current inspection and a reference system) can be conducted with existing production equipment at low cost. The result will tell you more about your actual quality exposure than any amount of training documentation.
Case Study 6: Managing Multi-Language and Regulatory Printing Requirements Across Global Markets
The Challenge They Faced
A pharmaceutical tube manufacturer supplying OTC topical medications had expanded distribution to 15 countries across the EU, Southeast Asia, and Latin America. Each market required different regulatory text: language variants, different required statement formats, varying font size minimums for active ingredient declarations, and market-specific serialization codes under national pharmaceutical track-and-trace systems.
Their existing printing setup — conventional offset with dedicated plate sets per market — required 15 sets of color-separated plates for each SKU: USD 900–2,400 in tooling per SKU per market variant. Across 8 active tube SKUs and 15 markets, that was up to USD 288,000 in plate tooling inventory — plates that became obsolete every time a regulatory requirement changed, which happened in at least three markets each year.
Managing the inventory of region-specific pre-printed tubes was equally costly: safety stock per market variant per SKU across 15 markets meant holding approximately 40 SKU-market combinations in inventory at any time. A regulatory text change triggered write-down of all affected tube inventory across all affected markets simultaneously.
The Solution They Implemented
The operation transitioned the regulatory text layer — all variable content including active ingredient statements, language-specific directions, batch codes, and serialization codes — to variable data printing (VDP) on a digital UV inkjet system integrated into the existing offset line.
Key Term: VDP (Variable Data Printing) — A digital printing capability that changes printed content — text, barcode, QR code, language variant — from tube to tube without stopping the machine or changing hardware. Every tube in a run can carry different regulatory text while the brand colors and decorative elements remain fixed.
The brand decoration — colors, logo, product photography — remained on the existing offset platform (lowest cost per tube at their volume). Only the regulatory text layer shifted to the digital VDP station, added as an inline module downstream of the offset printing stations. A centralized database of regulatory requirements by market was built and maintained by the regulatory affairs team, with approved text templates for each market pre-validated against local requirements.
The Results They Achieved
- Zero compliance violations across all 15 markets in the 24 months following implementation
- 40% reduction in inventory complexity — from 40 active SKU-market combinations in pre-printed tube stock to a single unprinted tube + variable text printed to order
- 6-week reduction in time-to-market for new regions — adding a new market language variant previously required 4–6 weeks for plate tooling; VDP requires a new approved text file (typically 3–5 business days regulatory review)
- Successful expansion into 5 additional international markets within 18 months of the new system going live — markets that were previously uneconomical due to small volume per market not justifying dedicated plate tooling
Key Takeaways for Your Operation
If you are serving or planning to serve multiple regulated markets from a single production facility, the economic case for VDP is not primarily about printing technology — it is about inventory and compliance risk management. Every pre-printed tube carrying market-specific regulatory text is a tube that becomes a write-down liability the moment the regulatory requirement changes.
The hybrid approach — fixed brand decoration on offset, variable regulatory content on digital — captures the cost efficiency of offset at volume while eliminating the tooling and inventory overhead of market-specific plate sets. For any operation managing more than three export markets with distinct regulatory requirements, this architecture is worth a formal cost comparison against your current plate inventory and market-specific stock-holding model.
Case Study 7: Cost Reduction Through Smart Equipment Investment and Process Optimization

The Challenge They Faced
A cosmetic tube contract manufacturer was being squeezed by two converging pressures: raw material cost increases of approximately 12% over 18 months, and competitive pricing pressure from manufacturers in lower-cost production geographies. Their gross margin on tube decoration had contracted from 34% to 26% over three years — not from a loss of volume, but from cost base growth outpacing the price increases they could pass through.
A cost analysis they commissioned revealed three specific drains: energy consumption on three mercury arc UV curing systems running at 14.2 kWh per operating hour combined; ink waste from conventional ink key adjustment (operators set ink keys conservatively, accepting over-inking to prevent color dropout); and machine downtime averaging 2.8 unplanned stops per machine per month at an average duration of 3.2 hours.
The Solution They Implemented
The operation applied a lean manufacturing assessment to their printing lines before making any capital decisions — mapping every step in the value stream, identifying non-value-adding activities, and quantifying the cost of each identified waste category.
Key Term: Lean Manufacturing — A production methodology focused on eliminating waste — defined as any activity that consumes resources without creating value for the customer. Applied to tube printing, the seven waste categories (overproduction, waiting, transport, over-processing, inventory, motion, and defects) all have direct counterparts in a printing operation’s daily workflow.
Three targeted investments followed the assessment: LED-UV curing conversion on all three printing lines; a precision ink metering system with closed-loop density control; and a predictive maintenance program based on machine sensor data — oil temperature, motor current draw, UV lamp power consumption — monitored against established control limits.
The Results They Achieved
- 32% reduction in total production cost per unit — the combination of energy saving, ink waste reduction, and downtime reduction compound across every tube produced
- 28% decrease in energy consumption — LED-UV curing drew 5.2 kWh combined per operating hour vs. the prior 14.2 kWh — a saving of approximately USD 41,000 per year at local industrial electricity rates
- 35% reduction in ink and material waste — precision metering reduced ink cost per 1,000 tubes from USD 3.80 to USD 2.47; setup waste reduced by 60% through recipe-based changeover
- Gross margin recovered to 31% within 18 months of the program completion — without a single price increase to customers
Key Takeaways for Your Operation
The sequence matters: assess before you invest. This operation’s lean assessment identified that their largest cost drain was energy — not labor, not ink, not downtime — which changed their capital priority from “replace the oldest machine” to “convert the UV curing systems.” That decision produced USD 41,000 in annual energy savings for approximately USD 28,000 in investment (retrofit LED-UV conversion on existing machines) — a payback of under 9 months.
If you have not conducted a formal cost analysis of your printing operations in the last two years — one that separates energy, labor, material waste, and downtime costs into individual line items by machine — you are making capital decisions without knowing which problem you are actually solving.
Case Study 8: Building Brand Loyalty Through Premium Printing Quality and Consistency
The Challenge They Faced
A cosmetic tube manufacturer supplying three mid-tier skincare brands was losing repeat orders. Post-project interviews with the brand buyers identified a consistent theme: batch-to-batch color variation was creating visible inconsistency on shelf between product restocks. Consumers noticed. Buyers switched suppliers when a competitor offered samples demonstrating tighter color consistency.
The manufacturer’s measured repeat order rate was 71%. Industry benchmarks for comparable operations run at approximately 85–88%. The gap — 14–17 percentage points — represented approximately USD 380,000 in annual revenue that was not recurring.
Their printing equipment was functional but operated without formal color specification standards. Color approval was based on visual press-side comparison under variable production lighting conditions — a method that introduces approximately ±ΔE 1.5 of subjective variation between approval decisions, on top of the process variation in the actual printing.
The Solution They Implemented
They established a formal brand consistency program: for each client SKU, a spectrophotometric press standard was created from the approved physical tube sample — L*a*b* aim points documented with target SID values and acceptable variance ranges. Every subsequent production run was measured against that standard using a calibrated benchtop spectrophotometer (D50 illuminant, 2° observer) at the start of the run, after every 5,000 tubes, and at run completion.
They also implemented a structured customer feedback program: after each delivery, the brand buyer received a one-page color conformance report showing mean ΔE, maximum ΔE, and the number of in-process measurement events for that production run.
Miyoda Packaging Machinery supports this type of color documentation program through their offset printing line configurations, which include optional integrated spectrophotometric measurement stations that log color data automatically against production timestamps — eliminating the manual measurement and recording steps that introduce data transcription errors.
The Results They Achieved
- Customer retention rate improved from 71% to 89% over 24 months — a 25% relative improvement driven entirely by documented color consistency, not by price changes
- 18% premium pricing achieved — two of three clients agreed to a price increase in the 12 months following the program implementation, citing the color conformance reports as evidence of a measurably superior service
- Repeat order rate increased by 45% — clients who had been placing 4–5 orders per year increased to 6–7, citing confidence in delivery consistency
- 22% of new business in the following year was referral-driven — brand buyers mentioning the color consistency program as a recommendation criterion
Key Takeaways for Your Operation
Consistency is a more powerful retention driver than quality level. A brand buyer who receives tubes that are consistently ΔE 1.8 from their target color, batch after batch, will stay. A buyer who receives tubes that are sometimes ΔE 1.2 and sometimes ΔE 2.8 — even though the average is acceptable — will switch, because the inconsistency creates unpredictable shelf presentation.
The color conformance report is not a quality assurance tool — it is a commercial tool. It makes visible a performance characteristic that was previously invisible to the customer and gives them a concrete reason to pay a premium and a concrete reason to stay. Documentation creates value beyond its compliance function.
Case Study 9: Rapid Response to Market Trends — How a Distributor Captured Market Share With Agile Production
The Challenge They Faced
A cosmetic tube distributor serving independent skincare brands was watching a recurring pattern: a new product category or ingredient trend would emerge (retinol reformulations in Q4 2022, bakuchiol in Q1 2023, barrier repair ceramides in Q3 2023), and their clients would request new tube printing for the trend-aligned SKU. By the time the distributor’s 6-week concept-to-production cycle had completed — 2 weeks for artwork approval, 2 weeks for plate tooling, 1 week for first-production approval, 1 week for delivery — competitors who moved faster had already captured the early adopter demand.
Three trend cycles in 18 months had cost the distributor an estimated USD 290,000 in orders that went to faster competitors. The problem was not manufacturing capability — it was the lead time structure of their existing printing setup.
The Solution They Implemented
The distributor invested in a versatile digital printing platform for short-run and rapid-launch work, configured alongside their existing offset line. Digital printing for volumes below 8,000 tubes eliminated the plate tooling stage entirely — taking concept-to-production from 6 weeks to under 2 weeks (artwork file validation, digital proofing on actual tube substrate, and production in a single accelerated sequence).
They also established a rapid prototyping workflow: a standardized artwork brief template pre-validated for digital output compatibility, a 48-hour digital tube proof cycle using actual production materials, and a cross-trained three-person rapid response team that could move a new SKU from brief to production-ready file without external prepress agency involvement.
Key Term: Concept-to-Production Time — The elapsed time from a confirmed product design brief to finished, inspected tubes ready for filling. For trend-dependent cosmetic SKUs, this is the primary competitive differentiator — brands that reach market in week 4 of a trend cycle capture 2–3× the volume of brands that reach market in week 8.
The Results They Achieved
- Concept-to-production time reduced from 6 weeks to 2 weeks for digital runs below 8,000 units
- 3 trending product categories captured before primary competitors in the 12 months following the capability upgrade
- 17% increase in market share in the indie and DTC skincare segment — the segment with the highest new SKU launch frequency
- 25% year-over-year revenue growth — driven by the combination of new trend-capture orders and increased share of wallet from existing clients who consolidated printing to the distributor’s faster service
Key Takeaways for Your Operation
In trend-sensitive categories, lead time is pricing. A distributor who can deliver printed tubes in 2 weeks commands a price premium that a 6-week supplier cannot. Brands will pay USD 0.08–0.12 per tube more for guaranteed 14-day turnaround when a trend window is open — and that premium more than covers the per-unit cost differential between digital and offset at batch sizes below 8,000 units.
The investment is not just the machine. It is the workflow surrounding the machine: the artwork brief template, the digital proofing cycle, the cross-trained team. A digital printer without a streamlined surrounding workflow does not produce 2-week turnaround — it produces a fast machine in a slow process.
Case Study 10: Building Competitive Advantage Through Innovation and Continuous Improvement
The Challenge They Faced
A cosmetic tube printing specialist had been operating for 11 years in what was becoming a commoditized market. New entrants from low-cost geographies were offering equivalent conventional tube printing at 15–20% lower prices. The specialist’s core capabilities — offset and screen printing on standard tube substrates — were no longer differentiating. Revenue had been flat for 3 years despite market growth. Three high-value clients had moved to lower-cost competitors in the prior 18 months.
The operation needed to create a capability set that competitors could not quickly replicate and that clients were willing to pay a meaningful premium to access.
The Solution They Implemented
The operation invested in what they called an “innovation lab” — a configuration of printing and finishing equipment specifically selected to enable specialty effects unavailable on standard tube decoration lines: inline hot stamping integrated with offset, high-build soft-touch UV varnish with textured spot-gloss patterning, holographic film lamination on tube bodies, and multi-substrate capability (PE, ABL, PBL, and aluminum) on a single mandrel transport line.
They devoted 15% of production capacity to developing proprietary processes for these specialty applications — systematically documenting the parameter sets, tooling configurations, and quality protocols for each technique until they could produce them reliably at commercial production speed. Six proprietary decoration techniques were developed and validated over 24 months.
They also changed their commercial approach: instead of quoting on customer-specified jobs, they began inviting brand clients to the production facility for “decoration workshops” — 2-hour sessions where brand designers could see and handle live samples of specialty effects and develop new packaging concepts around what was technically achievable.

The Results They Achieved
- 6 proprietary printing techniques developed unavailable from competitors in their market
- 40% price premium achieved for specialty decoration jobs compared to conventional tube printing — clients were paying for outcomes that competitors could not deliver
- 35% increase in average order value — brands that engaged with the specialty decoration approach consistently ordered higher-value jobs with more decoration steps
- Positioned as innovation leader in their regional market, leading to speaking invitations at two packaging industry trade events and three editorial features that generated inbound enquiries
Within 36 months of the innovation program launch, the operation had rebuilt its revenue growth trajectory to 22% year-over-year and re-engaged two of the three clients who had previously moved to lower-cost competitors.
Key Takeaways for Your Operation
Commoditization is not inevitable — it is the outcome of competing on the same attributes as everyone else. When price is the only differentiator, the lowest price wins. When decoration capability is the differentiator, the operation that can produce effects the client cannot source elsewhere commands pricing that cost-only competitors cannot challenge.
The decoration workshop approach is reproducible regardless of operation size. If you have specialty capabilities — even one or two effects that are unusually well-executed on your line — the question is whether your clients know they exist. Visible capability commands premium pricing. Invisible capability gets priced as a commodity.
Common Success Factors Across All Case Studies
Reading across the ten cases, five patterns appear consistently. These are not industry platitudes — they are specific operational characteristics that were present in every operation that achieved measurable results.

Factor 1: Strategic Equipment Investment
Every operation that achieved documented ROI within their target timeline shared one characteristic: they chose equipment that addressed the specific bottleneck they had identified, not the most impressive machine available or the cheapest machine that passed a surface-level specification review.
The pharmaceutical manufacturer in Case Study 2 chose equipment specifically for GMP batch record capability — not for maximum speed. The distributor in Case Study 3 chose equipment specifically for quick-change capability — not for maximum color count. The innovation specialist in Case Study 10 chose equipment for specialty decoration capability — not for throughput.
Understanding total cost of ownership — not purchase price — is the analytical foundation. A USD 15,000 machine that stops producing saleable output without warning two months after installation costs more than a USD 45,000 machine that runs at 97% uptime for 8 years. Evaluate machines by their 3-year TCO (Total Cost of Ownership), not their purchase price.
Key Term: TCO (Total Cost of Ownership) — The complete cost of owning and operating an asset over a defined period. For a tube printing machine, TCO includes purchase price, installation, training, energy consumption, maintenance and spare parts, quality-related waste, and the opportunity cost of unplanned downtime. TCO analyses consistently show that the lowest-purchase-price option is the highest-TCO option in 60–70% of equipment purchases.
Factor 2: Process Standardization and Training
Equipment without standardized processes does not consistently perform to specification. In every case where an equipment upgrade was combined with documented SOPs and operator training, performance improved faster and sustained longer than in cases where equipment alone was changed.
The relationship is multiplicative, not additive. An operator who understands why a process step exists — not just how to perform it — catches drift conditions earlier, escalates anomalies correctly, and makes better real-time decisions when the machine deviates from expected behavior. Training that produces understanding, not just procedural compliance, is the difference between a process that is controlled and one that is managed.
Factor 3: Quality-First Mindset
Every operation in these ten cases that achieved meaningful quality improvement did so by building measurement into the production process rather than inspecting for quality at the end. This distinction matters: end-of-line inspection finds defective tubes that have already been produced; in-process measurement prevents defective tubes from being produced in the first place.
The Lean Six Sigma principle that applies here is poka-yoke — designing the process so that defects cannot occur or are immediately detected — not the reactive quality model of catching defects after the fact. Lean Six Sigma case studies in cosmetics manufacturing have documented defect rate reductions of 40% and lead time reductions of 25% from systematic application of these principles, with ROI of 150% documented within 12 months of implementation.
Factor 4: Data-Driven Decision Making
The operations that made poor equipment decisions in these case studies — including ones mentioned in passing as negative comparisons — shared a common failure mode: they chose equipment based on sales presentation performance rather than documented production data from their specific substrate and product type.
The operations that made good decisions requested fill weight or color Cpk data from production trials on their actual substrates, contacted existing customers of the same machine independently, and evaluated 3-year TCO rather than purchase price. Data from the equipment’s actual performance in comparable production environments is the only reliable basis for a capital decision in this category.
Key Term: Cpk (Process Capability Index) — A statistical measure of how consistently a process performs within specification limits relative to natural process variation. For tube printing, Cpk ≥ 1.33 is the world-class target (means the process produces fewer than 64 defects per million opportunities). Cpk < 1.00 indicates an out-of-control process generating a measurable defect rate.
Factor 5: Customer-Centric Approach
The most durable competitive advantages documented in these ten cases — the brand consistency program in Case Study 8, the decoration workshop approach in Case Study 10, the VDP compliance solution in Case Study 6 — were all built around understanding what the customer’s actual problem was, not around demonstrating what the manufacturer’s equipment could do.
A color conformance report is valuable to a brand buyer not because it proves the tube was printed correctly, but because it eliminates the anxiety of wondering whether this batch will match the last one. A decoration workshop is valuable to a brand designer not because it shows impressive equipment, but because it opens design possibilities they did not know existed. Customer-centricity in tube printing means delivering certainty, not just capability.
How These Success Stories Apply to Your Situation
Assessing Your Current State
Before mapping any of these case studies to your own operation, you need an honest baseline. The most useful questions are the ones that produce uncomfortable answers:
What is your current defect rate — not the rate you report, the rate you actually produce including defects caught and removed before shipping? What is your average unplanned downtime per machine per month in hours, and what does that cost at your loaded machine rate? What is your current changeover time in minutes, and what is your economic minimum batch size based on that changeover cost? What is your repeat order rate, and what does your CRM data or order history tell you about the clients who did not reorder?
If any of these questions produce estimates rather than data, that absence of measurement is itself a finding. You are making production and capital decisions with less information than you need.
Planning Your Improvement Strategy
The sequence that appears across the most successful cases in this guide is consistent: measure first, then identify the highest-impact constraint, then invest in the targeted solution for that constraint, then measure again.
Operations that invested in equipment without a prior honest assessment of their specific constraint frequently found that the equipment solved a problem they had assumed they had rather than the problem they actually had. The preliminary assessment, which can typically be completed in 2–3 weeks using existing production data, is the highest-ROI investment you can make before any capital decision.
Prioritize by economic impact. The constraint costing you the most money — whether that is material waste, downtime, customer loss, or production complexity — is the one that deserves the first investment. The order of the case studies in this guide is not the order of investment priority for your operation. Your data determines that.
Avoiding Common Pitfalls
The most frequent failure mode in tube printing improvement programs is investing in equipment without addressing the surrounding process. A vision inspection system installed on a production line with inconsistent ink viscosity management will catch the defects that the inconsistent viscosity creates — but it will not prevent them. The investment solves the wrong problem.
The second most frequent failure is underestimating change management. New equipment with new workflows requires operators who understand why the new process is better, not just what the new procedure is. The operations in these case studies that sustained their improvements beyond 12 months were the ones that invested in training alongside equipment — not as an afterthought after commissioning was complete.
Measuring Success
Establish your baseline metrics before any change is made — not after. The comparison point is everything: without a before measurement, you cannot quantify what the investment achieved, which means you cannot justify the next investment to your leadership or ownership.
The key performance indicators that are most actionable for cosmetic and pharmaceutical tube printing operations:
| KPI | Measurement Method | World-Class Benchmark |
|---|---|---|
| Defect Rate (%) | Defective tubes / total tubes produced × 100 | < 0.5% with inline inspection |
| OEE (%) | Availability × Performance × Quality | ≥ 85% |
| Mean ΔE (color accuracy) | Spectrophotometric inline or sampling | < 1.5 average (premium cosmetic) |
| Changeover Time (minutes) | Time from last good tube of prior job to first good tube of next job | < 30 min (quick-change system) |
| Unplanned Downtime (hrs/month/machine) | Maintenance log | < 4 hours/machine/month |
| Customer Retention Rate (%) | Orders from prior-year clients / prior-year total clients | ≥ 85% |
| Ink Consumption Cost per 1,000 tubes | Monthly ink cost / monthly tube volume × 1,000 | Benchmark to supplier data |
Frequently Asked Questions About Tube Printing Success
1. How long does it typically take to see ROI from equipment investment?
The payback timeline varies by investment type and operation scale, but documented across these case studies: targeted system additions (inline measurement, vision inspection, precision metering) typically achieve payback within 6–14 months because they address specific cost-generating problems with immediate, measurable impact. Larger equipment replacements — full line upgrades — typically achieve payback within 18–36 months for mid-volume cosmetic operations. Pharmaceutical operations with regulatory compliance as a driving factor often see faster effective ROI because the revenue enabled by compliance capability (new contracts, market access) adds to the direct cost savings.
2. What’s the difference between quality improvements and cost reduction — can we achieve both?
Yes, and the two are typically not in opposition — they are complementary. Quality improvement reduces scrap, rework, customer complaints, and repeat-order loss — all of which are cost items. Cost reduction through process optimization (ink metering, LED-UV energy efficiency, changeover reduction) typically improves quality consistency simultaneously by reducing process variation. Case Study 7 is the clearest example: every cost reduction intervention — LED-UV conversion, precision metering, predictive maintenance — also reduced the process variation that drives defects.
3. How do we know if our current equipment is holding us back?
Three warning signs that appear consistently across the case studies: (1) your economic minimum batch size is higher than the orders you are declining or pricing uncompetitively; (2) your measured defect rate is above 1.5% or your ΔE performance is consistently above 2.5; (3) your equipment cannot generate batch records or documentation that a significant portion of your target customer base requires. Any one of these is a constraint. All three together indicate equipment that is actively limiting your addressable market, not just your production efficiency.
4. What training and support do we need for successful implementation?
The minimum effective training program for any tube printing equipment upgrade includes: structured operator training of 5–8 days on-site at the machine, covering HMI operation, changeover procedures, quality measurement protocols, and first-line fault diagnosis; documented operator qualification records (signed assessment confirming competency before unsupervised production); and maintenance team training on PM schedules, calibration procedures, and predictive indicator interpretation. Ask suppliers for the training curriculum before purchase — its detail and specificity is a reliable indicator of how well-supported you will be post-commissioning.
5. How can we transition to new equipment without disrupting production?
A phased implementation approach — the approach used in Case Studies 2 and 7 — is the most reliable method for minimizing production disruption. Replace one line at a time while maintaining parallel capacity on existing equipment. Commission and validate the new line over 4–6 weeks using non-critical SKUs (high-volume standard runs with relaxed color tolerances) before moving pharmaceutical or premium cosmetic SKUs onto it. Maintain clear rollback procedures: if the new line does not achieve commissioning targets within the agreed timeline, what existing equipment continues to run the impacted orders? Document this plan before the new equipment arrives.
6. What should we consider when choosing between different printing technologies?
The decision framework from these case studies: (1) Calculate your annual volume per SKU — this is the primary filter between offset (above 25,000 units), screen (5,000–25,000 units), and digital (below 8,000 units). (2) Identify your design requirements that exceed standard CMYK capabilities — metallic effects, thick opaque white, tactile varnish — these determine whether a hybrid decoration platform is required. (3) Confirm your regulatory documentation requirements — pharmaceutical production requires GMP-capable control systems that not all machine platforms support. (4) Evaluate 3-year TCO, not purchase price. (5) Request production performance data from trials on your actual substrate. For a detailed comparison of tube printing method capabilities and cost crossover points, Miyoda’s printing method comparison guide provides a structured decision framework with documented cost data.
7. How do we ensure consistent quality across multiple production shifts?
Documented measurement protocols — specific measurements, at specific intervals, against specific documented standards — are the only mechanism that produces cross-shift consistency. If quality approval depends on operator judgment rather than documented measurement against a numerical standard, quality will vary with operator experience and shift fatigue. The color conformance program in Case Study 8 achieved cross-shift consistency not through better training (though training improved) but through numerical standards that removed judgment from the approval decision: ΔE ≤ 2.0, pass; ΔE > 2.0, stop and adjust.
8. What are the hidden costs we should consider in tube printing operations?
The costs that most commonly do not appear in an operation’s published production cost analysis: (1) Customer retention loss from quality inconsistency — quantified in Case Study 8 at USD 380,000 annually; (2) Declined orders due to setup cost economics — quantified in Case Study 3 as 40% of incoming custom enquiries; (3) Ink waste from over-inking and changeover wash-up — quantified in Case Study 7 as 35% of total ink cost; (4) Energy premium from mercury arc UV vs. LED-UV — quantified in Case Study 7 as USD 41,000 per year; (5) Regulatory documentation remediation costs — conservatively USD 38,000 in legal and consulting fees when documentation gaps are discovered during a buyer audit, plus the opportunity cost of the delayed contract. Total these categories for your operation before your next capital allocation conversation.
9. How can we use tube printing as a competitive differentiator?
Case Studies 8 and 10 provide the two primary models: consistency as differentiator (every batch matches specification, documented and reported to the client) and capability as differentiator (decoration effects not available from competing suppliers). Both require investment beyond the machine — the consistency model requires measurement infrastructure and customer-facing reporting; the capability model requires R&D capacity and a commercial approach that makes capabilities visible to the right buyers. Either model is executable for an operation of any size, but neither happens by accident.
10. What’s the best approach to scaling production without quality issues?
The pharmaceutical manufacturer in Case Study 2 provides the clearest model: establish standardized operating procedures before scaling, not during. Quality systems designed for 2.4 million tubes per month at two lines do not automatically transfer to 6 million tubes per month at five lines — each new line needs the same documented processes, operator qualifications, and measurement protocols as the existing lines, not an assumption that “they’ll figure it out.” The scaling plan should include: time for operator recruitment and training before the new line is commissioned; a qualification run for each new line using non-critical SKUs; and a documented ramp-up schedule that reaches full production speed only after quality metrics on the new line match those on the existing validated lines.
11. How do we balance sustainability goals with production efficiency?
Case Study 4 demonstrates that the apparent tension between sustainability and production efficiency is largely false. The operation’s ink system transition reduced both environmental impact (VOC emissions near-zero) and production costs (18% ink cost reduction through precision metering). LED-UV conversion reduces energy consumption 55–65% while simultaneously improving cure consistency and eliminating mercury lamp waste — a sustainability and efficiency win simultaneously. The operations that struggle with sustainability transitions are those that treat them as isolated compliance exercises; the ones that succeed are those that design the transition around both the environmental and the production performance requirements, running formal pilot protocols before committing to full conversion.
12. What metrics should we track to measure printing performance?
The seven KPIs in the table above (Defect Rate, OEE, Mean ΔE, Changeover Time, Unplanned Downtime, Customer Retention Rate, and Ink Cost per 1,000 tubes) are the minimum useful set for most cosmetic and pharmaceutical tube printing operations. Each should be measured before any improvement program begins, so that the impact of subsequent changes is documentable rather than anecdotal. Detailed manufacturing KPI tracking frameworks are available from operations management literature, but the most important discipline is not which KPIs you choose — it is that you choose them, establish baselines, and review them on a cadence that is short enough to detect problems before they become crises (weekly for defect rate and OEE; monthly for customer retention and ink cost).
Taking Action: Your Next Steps
Step 1: Evaluate Your Current Operations
Gather your actual data — not estimates — on defect rate, OEE, changeover time, unplanned downtime, repeat order rate, and ink cost per 1,000 tubes. If this data does not exist in a retrievable form, the first step is to instrument your production environment to generate it. A 4-week data collection period before any other action is taken will pay dividends across every subsequent decision.
Step 2: Define Your Goals and Priorities
Identify the single highest-impact constraint in your current operation — the one generating the largest cost, the largest customer retention risk, or the largest revenue limitation. That constraint, not the most technically interesting improvement opportunity, is where your first investment should go.
Step 3: Research Solutions and Equipment Options
Le Gamme de produits Miyoda Packaging Machinery covers tube offset printing, screen printing, and integrated multi-decoration lines for cosmetic and pharmaceutical tube production. Request demonstrations on your actual tube substrate type and ask for production data from existing customers at comparable production scales.
For industry context on print technology developments and equipment specifications, Packaging Digest’s industry coverage et Polytype’s digital printing technology documentation provide current benchmarking information for both conventional and digital tube decoration.
Step 4: Develop Your Implementation Plan
Define your success metrics, your implementation timeline (including commissioning, training, and qualification before full production), and your rollback plan if commissioning does not meet targets. Assign accountability for each milestone — not to a team, but to a named individual.
Step 5: Execute and Monitor
Implement changes systematically. Measure at the intervals you established in Step 1. If results at 90 days do not match your projections, investigate the gap before assuming the approach is wrong — most implementation shortfalls at 90 days are traceable to a specific process step that was not executed as designed, not to a fundamental flaw in the improvement strategy.
Your Path to Printing Excellence
The ten operations in this guide achieved their results by solving the right problem with the right solution and measuring the outcome. None of them achieved excellence by accident, and none of them achieved it through a single large investment that solved everything simultaneously. Each started by being honest about what their specific constraint was, then made targeted, measurable changes to address it.
Your competitive advantage does not require the most expensive equipment or the largest facility. It requires clarity about where you are losing money or missing revenue, the discipline to address that specific constraint rather than the most visible or technically interesting problem, and the measurement infrastructure to know when you have achieved what you set out to achieve.
The results documented in these case studies — 67% defect reduction, 150% capacity growth, 6-week to 2-week concept-to-production, 99.2% automated detection accuracy — are not exceptional. They are achievable by any operation that applies the same diagnostic rigor, investment discipline, and measurement accountability that the operations in these cases demonstrated.
Ready to Transform Your Tube Printing Operations?
Don’t let printing challenges limit your growth. The manufacturers and distributors who achieve outstanding results are those who take action before the constraint becomes a crisis.
Miyoda Packaging Machinery specializes in tube production and decoration equipment for cosmetic and pharmaceutical manufacturers — from high-speed tube offset printing machines to complete laminate tube production lines. Their application engineers work with buyers to diagnose production constraints, recommend equipment configurations matched to specific substrate types and production volumes, and support the implementation process through commissioning and operator training.
👉 Explore the Full Tube Production Machine Range →
👉 Read the Tube Printing Technology Comparison Guide →
👉 Contact us today for a free production assessment — bring your defect rate data, your changeover time, your current machine utilization, and your target improvement. We will show you specifically how other operations at your scale and substrate type achieved their results, and what a realistic improvement roadmap looks like for your situation.
Glossaire des termes clés
| Term | Definition |
|---|---|
| ΔE (Delta E) | A numerical measure of color difference. ΔE 1.0 is invisible to the human eye. ΔE 2.0 is the standard for Pantone-matched cosmetic tubes. ΔE > 3.0 is visibly different on shelf and triggers rejection. |
| ABL (stratifié à barrière d'aluminium) | Multi-layer tube construction with an aluminum foil barrier layer between polyethylene. Near-complete oxygen and moisture barrier. Standard for pharmaceutical topicals and barrier-sensitive serums. |
| PBL (stratifié à barrière plastique) | All-plastic laminated tube using EVOH polymer barrier instead of aluminum foil. Compatible with PE recycling streams. Requires UV-primer/corona pre-treatment for digital printing adhesion. |
| Cpk (indice de capacité du processus) | Statistical measure of how consistently a process performs within specification limits. Cpk ≥ 1.33 is world-class for tube printing. Cpk < 1.00 means the process is generating a measurable defect rate. |
| GMP (Good Manufacturing Practice) | Regulatory framework governing production quality, documentation, and equipment qualification for pharmaceutical and regulated cosmetic manufacturers. |
| HMI (Human-Machine Interface) | The touchscreen or control panel through which operators interact with the machine. Advanced HMI systems store complete machine recipes per SKU, enabling consistent setup without manual parameter re-entry. |
| IQ/OQ (Installation/Operational Qualification) | Two-stage pharmaceutical equipment validation protocol. IQ confirms correct installation; OQ verifies the machine operates within specification across its full operating range. |
| LED-UV Curing | Ink curing using LED lamp arrays at defined UV wavelengths. Uses 55–65% less energy than mercury arc UV. No mercury content. LED lamps last 20,000+ hours vs. 1,000–2,000 hours for mercury arc. |
| OEE (efficacité globale des équipements) | Manufacturing performance metric: OEE = Availability × Performance × Quality. 85% is world-class for tube printing. Below 72% indicates significant recoverable losses. |
| SID (Solid Ink Density) | Densitometric measurement of ink coverage on a solid printed patch. Used for real-time color control on offset printing lines. Standard targets differ by color channel. |
| SPC (Statistical Process Control) | Use of control charts to monitor production parameters in real time, detecting process drift before defects occur. |
| TCO (coût total de possession) | Complete cost of owning and operating equipment over a defined period — including purchase price, installation, training, energy, maintenance, waste, and downtime losses. |
| VDP (Variable Data Printing) | Digital printing capability that changes printed content tube-to-tube without stopping the machine. Enables multi-language regulatory text, serialization, and batch coding within the primary decoration pass. |
| COV (composés organiques volatils) | Carbon-based chemicals that evaporate at room temperature. Present at 40–60% by weight in solvent-based inks. Near-zero in water-based and UV-curable systems. Subject to EU Industrial Emissions Directive limits. |